Introduction
Here is a simple yet powerful method that I’ve been developing and using successfully. This method serves two causes. First, it enables to view ‘visually’ the current state of systems compliance with the enterprise architecture. Secondly, the suggested method encourages project managers and programmers to comply with and adapt to the enterprise architecture.
How it works?
The method is based on a score card and the visual presentation of the results given to each and every system. The score card lists all parameters that could be measured and indicates enterprise architecture compliance. Those parameters could be business oriented or technical - for example (respectively), does the system support key business processes?, or is it a web based system? I, for example, use the following parameters; but bear in mind that every enterprise has got its own set of definitions and goals and therefore should define its own parameters.
Sample Scorecard:
| Parameter | Mark |
| Serve more than one business process | 6 |
| Serve KBP (key business process) | 10 |
| Maintain more then one information logical schema object | 5 |
| Web app | 6 |
| OO system | 2 |
| Expose services | 2 |
| More then three layers | 3 |
| Data Access Layer | 2 |
| ORM | 2 |
Regardless of the parameter type, you should give each and every parameter a mark. That scorecard should be published across the enterprise to let every program manager and programmer know how much his responsibilities comply with the enterprise architecture.
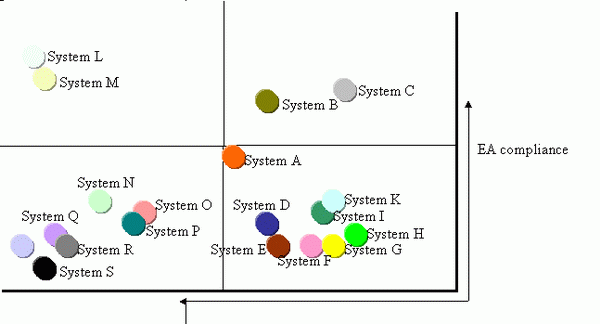
Now, for the stimulus that will push project managers and programmers to use that scorecard: displaying publicly the results of the systems scores. To display the scores, I’m using a two dimensional graph. The Y axis reflects the score of the given system by the scorecard. The X axis reflects the usability of the system. The system usability can be measured by two main factors:
- The number of users employing the system.
- The nature of the system: core or administrative.
After drawing the systems on the graph, draw the middle line of the X and Y axes so that the graph surface should split into four squares. The graph should look like this:

The program manager should be encouraged to reach the upper squares. This could be achieved by publishing such a graph every 4 months, after using the score card to evaluate the current score of every system. It is better to give the marks after discussing the different parameters with the system PM. As for you, the enterprise architect, all systems appearing in the bottom left square are the ones you should be most concerned for. These are the most utilized systems yet the least compatible with the architecture.
Conclusion
Using well known parameters with scores, together with the published results, set the targets that should be reached and the stimulus to do so for PMs and programmers. Displaying the scorecard results also help managers and enterprise architects to see the progress of the enterprise architecture process.
