Introduction
Finally I found an algorithm to compute that member of the number-sequence
{... 0.02, 0.05, 0.1, 0.2, 0.5, 1, 2, 5, 10, 20, ...}, which is most close to a given number.
The Code
Private Function GetSnapValue(ByVal Number As Double) As Double
Dim DecimalRangeBottom As Double = 10 ^ Int(Math.Log10(Number))
Dim Numb As Double
Dim Prev As Double = DecimalRangeBottom
For Each Factor As Double In New Double() {2, 5, 10}
Numb = Factor * DecimalRangeBottom
If Numb >= Number Then Exit For
Prev = Numb
Next
If Numb - Number < Number - Prev Then
Return Numb
Else
Return Prev
End If
End Function
A Test
Public Sub Main()
   For I As Integer = -10 To 10
      Dim Numb As Double = 63 ^ (I * 0.23)
      Console.WriteLine(String.Format( _
         "Number: {0,-22}SnapValue: {1,-5}", Numb, GetSnapValue(Numb)))
   Next
   Console.ReadLine()
End Sub
Outputs
Number: 7,26970413682593E-05  SnapValue: 5E-05
Number: 0,000188523312755006  SnapValue: 0,0002
Number: 0,000488892515887717  SnapValue: 0,0005
Number: 0,00126783201821641   SnapValue: 0,001
Number: 0,0032878352074914    SnapValue: 0,002
Number: 0,00852625599945599   SnapValue: 0,01
Number: 0,0221109139541476    SnapValue: 0,02
Number: 0,0573396477796245    SnapValue: 0,05
Number: 0,148697390542496     SnapValue: 0,1
Number: 0,38561300618949      SnapValue: 0,5
Number: 1                     SnapValue: 1
Number: 2,59327352539712      SnapValue: 2
Number: 6,72506757752559      SnapValue: 5
Number: 17,4399397053036      SnapValue: 20
Number: 45,2265339222859      SnapValue: 50
Number: 117,284773066139      SnapValue: 100
Number: 304,151496924626      SnapValue: 200
Number: 788,748024684536      SnapValue: 1000
Number: 2045,43937062368      SnapValue: 2000
Number: 5304,38376764334      SnapValue: 5000
Number: 13755,7179931757      SnapValue: 10000
This is useful, e.g., for an auto-scaling ChartControl, to compute the positions of the orientation-lines that way, that the line-caption-numbers have minimum fractional digits.
Using the Code
It may look like this:


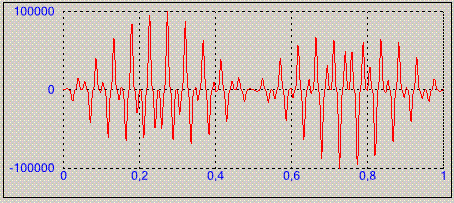
Shown is the same chart in different sizes of the Chartcontrol. The control did a proper autoscale to fill the whole available space with the chart, and the gridlines use the plus of space to be computed in a higher precision.
No user-input is required to adapt the control to a completely different range of values:

That's All
Here on CodeProject are published much more powerful Chart-Controls than mine, but I haven't checked out whether there is one with that feature.
History
- 7th January, 2008: Initial post
