Most of you are well aware of command line profiling for ASP.NET application using VSPerfASPNETCmd command line tool. This can easily profile your ASP.NET Web applications which is hosted on IIS. We just need to run VSPerfASPNETCmd command with the required parameter. Once profiling has been done, we can inspect the generated performance report (.vsp) file within Visual Studio. But, do you know we can do the complete profiling within Visual Studio itself. How? Here you go.
[Note: I recorded a quick 3 min video on the same and embedded at the end.]
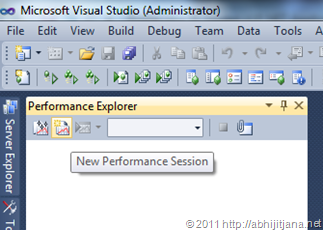
Start a new instance of Visual Studio 2010 and Open Performance Explorer from Analyze Menu. Click on the “New Performance Session” icon.

This will create a new Performance session for you with two different folders, Reports (which is the repository for all .vsp files) and Targets (Targets folder shows the binaries that are profiled in the current session).

Now, here is the trick. Right click on “Targets” folder and click on “Add Existing web Site…”

The below dialog will appear where we have to provide the URL of your application which is hosted on IIS.

Click on OK, you will find the associated file that targeted to your web application within the targets folder.

Now you can start profiling by clicking on “Start Profiling” option from the Performance session context menu.

Now you can see your profiling being started and checkout the targeted process Id for profiling (In Performance output window). Yes, it’s targeted to the worker process (w3wp.exe) for the application which is running at IIS.


Stop profiling when you are done with the navigation of your application, you will find the generated reports under reports folder.


Now you can inspect the performance report within your Visual Studio itself.
Here is a quick video:

Here are a few useful tips and tricks on profiling:
Hope this helps.
Cheers!
Aj
Filed under: ASP.NET 4.0, IIS, Profiler, Visual Studio 2010


