Introduction
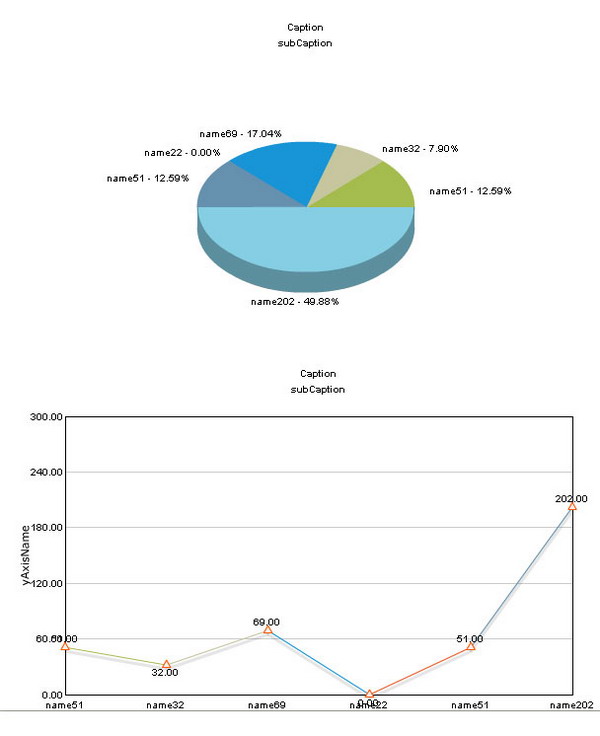
Fusion Charts help you to create animated and interactive Flash charts for web and desktop applications. You have to create the XML and pass it to the provided SWF files for each graph type. This helper class facilitates the process of creating the required XML and in the integration with the ASP.NET page.
Using the Code
The code lies in three files:
- Charts.cs
This file contains FusionChartBase (abstract), FusionPieChart, FusionLineChart, and FusionChartUtility.
- DataSetHelper.cs
This file is not related to Fusion Charts. It is a collection of useful code that I found here and there. You should check this out.
- Default.aspx
The page contains two DIVs and a Button. Pie and line charts are loaded into the DIVs on the Button's Click event.
The classes are quite long, so I'm only including the button click code here:
protected void btnShow_Click(object sender, EventArgs e)
{
FusionPieChart pieChart = new FusionPieChart();
pieChart.showNames = true;
pieChart.showPercentageInLabel = true;
pieChart.showPercentageValues = false;
string chartHtml = pieChart.CreateSetElement(BuildData(), FusionPieChart.Pie3D,
divPieChart.ClientID, "name", "value",
"text", "id", "test.aspx?id=", true, 600, 400);
divPieChart.InnerHtml = chartHtml;
FusionLineChart lineChart = new FusionLineChart();
divLineChart.ClientID, "name", "value", 100, 100);
chartHtml = lineChart.CreateSetElement(BuildData(), FusionLineChart.Line2D,
divLineChart.ClientID, false, "", "name",
"value", "text", "id", "", true, 600, 400);
divLineChart.InnerHtml = chartHtml;
}
Points of Interest
I did not use Adobe Flex because it was taking too much time for me to develop graphs, and Fusion Charts offered me a quick solution, but it has a number of limitations. After creating all these classes, I had to switch back to Adobe Flex. I used the Fusion Charts XML passing approach with Adobe Flex, and life is beautiful. :-)
History
- 9th February, 2009: Initial post
