Yesterday, we showed you how to bind the jqxGrid to SQL Database using ASP .NET MVC 3. Today, we will do the same for the jqxChart widget. In this post, you’ll learn how you can use jqxChart with ASP.NET MVC 3. If you haven’t already installed ASP.NET MVC 3, use this resource. For this help topic, you’re also going to need the Entity Framework: http://www.microsoft.com/download/en/details.aspx?id=18504. We will use the Northwind database which you can download from here.
-
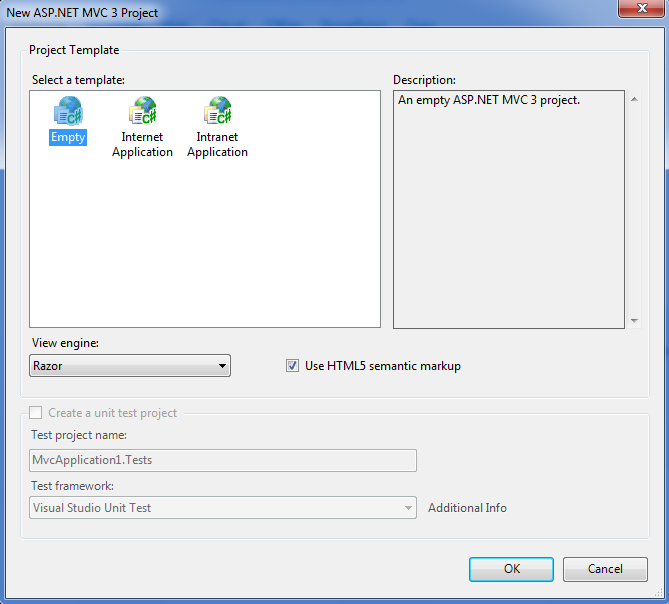
Create a new ASP.NET MVC 3 project and choose the “Empty project” option for template. For “View engine”, select “Razor”.

- You have to load the database. Drag the files: “NORTHWND.LDF” and “NORTHWND.MDF” and drop them over the “App_Data” directory in your project. If there’s no “App_Data” folder, then right click on the white space in the “Solution Explorer” choose “Add -> Add ASP.NET Folder -> App_Data”.

- After that, click with the right mouse button on the “Scripts” directory and choose “Add -> Existing Item”.

In the opened dialog, select the following JavaScript files: “jquery-1.7.1.min.js, jqxdata.js, jqxcore.js, jqxchart.js” from your jqwidgets folder.
- In the next step, you have to include the
jqxChart’s CSS dependencies – “jqx.base.css”. Just right click on the “Content” directory, after that select “Add -> Existing Item”, choose “jqx.base.css” from your folder and click “Add”.

- Expand the “View” directory after that the “Shared” and double click on “_Layout.cshtml”. Include all the files you’ve added into the previous steps. If there are older versions of jQuery included, in the “_Layout.cshtml” file, just delete them.

After finishing the last step, your “_Layout.cshtml” should look like this:
<!DOCTYPE html>
<html>
<head>
    <meta charset="utf-8" />
    <title>@ViewBag.Title</title>
    <link href="@Url.Content("~/Content/Site.css")"
    rel="stylesheet" type="text/css" />
    <link href="@Url.Content("~/Content/jqx.base.css")"
    rel="stylesheet" type="text/css" />
    <link href="@Url.Content("~/Content/jqx.classic.css")"
    rel="stylesheet" type="text/css" />
    <script src="@Url.Content("~/Scripts/jquery-1.7.1.min.js")"
    type="text/javascript"></script>
    <script src="@Url.Content("~/Scripts/jqxcore.js")"
    type="text/javascript"></script>
    <script src="@Url.Content("~/Scripts/jqxdata.js")"
    type="text/javascript"></script>
    <script src="@Url.Content("~/Scripts/jqxchart.js")"
    type="text/javascript"></script>
</head>

<body>
    @RenderBody()
</body>
</html>
- In the next step, we’re going to create our Models. Now right click on the “Models” folder. Select “Add -> New Item”. Choose “Data” from the tree view in left. Select “ADO.NET Entity Data Model” and click “Add”.

In the “Choose Model Contents” section select “Generate from database” and click Next.

In the “Choose Your Data Connection” section, click next. Then, the next section (“Choose Your Database Objects”), check the “Tables” and “Stored Procedures” checkboxes and click “Finish”.

- As a data source, we are going to use the “
Orders” table. To add entity objects and DbContext, you have to expand the Models directory. Double click on “Model1.edmx”. In the diagram that appeared, right click on the white space and choose “Add Code Generation Item”. In the tree view in left, select “Code”, choose “ADO.NET DbContext Generator” and click “Add”.

- After that, press F6 to Build your project.
- Now we are ready to add our Controller. Right click on the “Controller” folder and after that choose “Add -> Controller”. Rename it “OrdersController”. The chosen template should be “Controller with read/write actions and views, using Entity Framework”. For
Model class, select “Order (Project.Models)” and for Data context class “NORTHWNDEntities2 (Project.Models)” after that choose “Add”.

- After the generation of the controller have been completed, go to the “Controllers” folder and double click on “OrdersController.cs”. Add the following method after the “
Index” method:
public JsonResult GetOrders()
{
    var orders = db.Orders.ToList<Order>();
    var orderDetails = db.Order_Details.ToList<Order_Detail>();
    var products = db.Products.ToList<Product>();
    var result = (from d in orderDetails
                    join o in orders on d.OrderID equals o.OrderID
                    join p in products on d.ProductID equals p.ProductID
                    select new { o.OrderDate, d.Quantity, p.ProductName }).Take(50);
    return Json(result, JsonRequestBehavior.AllowGet);
}
- After that, go to the “Views/Orders” folder in your project. Double click on “Index.cshtml”. Put the following content there:
<script type="text/javascript">
$(document).ready(function () {
var source =
{
datatype: "json",
datafields: [
{ name: 'OrderDate', type: 'date' },
{ name: 'Quantity' },
{ name: 'ProductName' }
],
url: 'Orders/GetOrders'
};
var dataAdapter = new $.jqx.dataAdapter(source,
{
autoBind: true,
async: false,
downloadComplete: function () { },
loadComplete: function () { },
loadError: function () { }
});
var settings = {
title: "Orders by Date",
showLegend: true,
padding: { left: 5, top: 5, right: 5, bottom: 5 },
titlePadding: { left: 90, top: 0, right: 0, bottom: 10 },
source: dataAdapter,
categoryAxis:
{
text: 'Category Axis',
textRotationAngle: 0,
dataField: 'OrderDate',
formatFunction: function (jsonDate) {
var offset = new Date().getTimezoneOffset() * 60000;
var parts = /\/Date\((-?\d+)([+-]\d{2})?(\d{2})?.*/.exec(jsonDate);
if (parts[2] == undefined)
parts[2] = 0;
if (parts[3] == undefined)
parts[3] = 0;
return $.jqx.dataFormat.formatdate
(new Date(+parts[1] + offset + parts[2]*3600000 +
parts[3]*60000), 'dd/MM/yyyy');
},
showTickMarks: true,
tickMarksInterval: Math.round(dataAdapter.records.length / 6),
tickMarksColor: '#888888',
unitInterval: Math.round(dataAdapter.records.length / 6),
showGridLines: true,
gridLinesInterval: Math.round(dataAdapter.records.length / 3),
gridLinesColor: '#888888',
axisSize: 'auto'
},
colorScheme: 'scheme05',
seriesGroups:
[
{
type: 'line',
valueAxis:
{
displayValueAxis: true,
description: 'Quantity',
axisSize: 'auto',
tickMarksColor: '#888888',
unitInterval: 20,
minValue: 0,
maxValue: 100
},
series: [
{ dataField: 'Quantity', displayText: 'Quantity' }
]
}
]
};
$('#jqxChart').jqxChart(settings);
});
</script>
<div id="jqxChart" style="width: 600px;
height: 400px;"></div>
- In the last step, expand “Global.asax” and double click on “Global.asax.cs”. Change the “
RegisterRoutes” method to look like this:
public static void RegisterRoutes(RouteCollection routes)
{
routes.IgnoreRoute("{resource}.axd/{*pathInfo}");
routes.MapRoute(
"Orders",
"{controller}/{action}/{id}",
new { controller = "Orders", action = "Index",
id = UrlParameter.Optional }
);
}
Press F5 and see the result:

CodeProject
