Introduction
This article is Part 2 of Windows Debugging Techniques. This article is also concentrated on Application crashes. This article explains how to use Application Verifier and DebugDiag for debugging application crashes.
Note:This is series of articles divided into 5 parts
Part 1: Windows Debugging Techniques - Debugging Application Crash (Windbg)
Part 2: Windows Debugging Techniques - Debugging Application Crash (DebugDiag, AppVerifier)
Part 3: Windows Debugging Techniques - Debugging Application Crash (Self Dump Generation)
Part 4: Windows Debugging Techniques - Debugging Memory Leaks (Perfmon)
Part 5: Windows Debugging Techniques - Debugging Memory Leaks (CRT APIs)
Pre-Requisites
To do the practical assignments explained in the article below, the following are required:
- DebugDiag
- Application Verifier
Background
This article will explain other techniques in the dump analysis.
These techniques are a lot simpler than windbg, but they have their own limitations.
Let's have a look at them one by one.
DebugDiag
"The Debug Diagnostic Tool (DebugDiag) is designed to assist in troubleshooting issues such as hangs, slow performance,
memory leaks or fragmentation, and crashes in any user-mode process." (microsoft.com)
DebugDiag Tool is much simpler to use compared to other tools for debugging.
The best part being an HTML report, which is being generated that gives all detailed information.
DebugDiag can do a lot of things like:
- Crash Analysis
- Hang analysis
- Memory Leak Analysis
- Performance analysis
Currently, the scope of our article is limited to Crash Analysis. Let's start step-by-step.
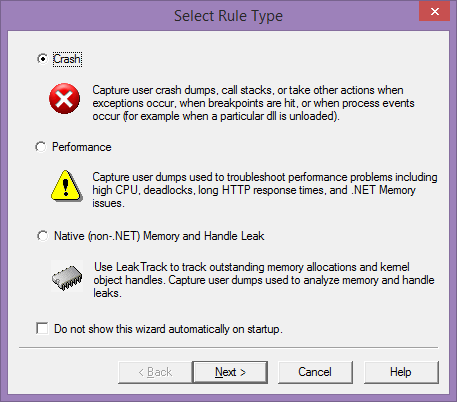
Step 1: Launch the DebugDiag, You Would be Presented with this Screen

This shows the different options available with DebugDiag, as of now just click Cancel and continue.
Step 2: Configure the Application Symbols
Goto Tools->Options & settings, you would be presented with the following screen.

Goto Second Text box, Symbol search path, add the path to the pdb file. We are continuing with the same example which we took in Part 1, i.e., Appcrash.exe.
int main()
{
	int *p = NULL;
	cout<<"This is Start";
	*p = 10;
	cout<<"This is End";
	return 0;
}
Step 3: Initiate the Dump Analysis
Click on AdvancedAnalysis Tab and select Crash/Hang Analyzers as shown below.

Step 4: Add The Dump File for Analysis
Click on "Add Data Files" Button, and select the dump file as shown below:

Step 5: Start Analysis
Click on "Start Analysis" button, you will be presented with the following report.

The actual report will be a lot more than this, but I have cut the most interesting information. This stack trace looks quite similar to what we have seen in windbg, AppCrash!main+39 [e:\study\windows internals\training\sample code\appcrash\appcrash\source.cpp @ 9].
So again, this is pointing to line number 9, but the actual issue is on line number 8 (the details for which we have explained in Part 1).
We are presented with some other information also like, PID, time spent in user mode, time spent in kernel mode, etc.
All this is available in Windbg too, but this information is presented in an easy to read, understandable and transferable format.
The only drawback with this approach being that we can just see the report being presented and cannot run any commands for real analysis as in Windbg.
This is useful if we just want a quick report of the dump and not actually sit and analyze.
Application Verifier
"Application Verifier assists developers in quickly finding subtle programming errors that can be extremely difficult to identify with normal application testing. Using Application Verifier in Visual Studio makes it easier to create reliable applications by identifying errors caused by heap corruption, incorrect handle and critical section usage." (MSDN)
We will be using Application Verifier for generating and analyzing the crash dump.
Step 1: Launch the Application Verifier
Go to run prompt and Type "AppVerif.EXE" as shown below:

You will be getting screen as shown below:

Step 2: Add the Application which Needs to be Verified, in our Case it is AppCrash.exe

We also need to configure different parameters for debugging. In our case, we will be selecting on "Basics":

Step 3: Click on save and then click on Exit
Step 4: Run the Application, in our case it is AppCrash.exe
Step 5: Once it has finished, open the AppVerifier again, like in Step 1
Step 6: Configure the Symbols
Click on View->Logs, go to bottom of the screen and enter the path to pdb file of AppCrash.exe.

Step 7: Click on view Button
It will show up in the below screen, which will have similar analysis data like Windbg and DebugDiag.

So the question is, what did we achieve by using Application verifier that was not there with other methods? The main thing is that there is no need to worry about taking the crash dump, it will be taken care of automatically.
We can just configure the application once and start using it normally, whenever it fails we can always check the report.
The drawback with this approach is, this needs to be installed on a target machine, which is normally not feasible.
Application Verifier is the tool to identify issues during development cycles and on the developers system, this way
we assess potential issues in the application even before we make the release.
Summary
So in this article, we learned about DebugDiag and AppVerifier. Both give almost the same output but debugdiag gives more details.
AppVerifier should be considered for use during development cycles. DebugDiag should be considered for release cycles for quick analysis, but for detailed analysis WinDbg is the only solution.
In both Part 1 and Part 2, we have discussed regarding various methods to analyze the App Crashes, with one drawback: the need to take the dump manually, which obviously requires the issue to be reproduced, which might not happen in quite a few scenarios.
Please go through Part 3 : http://www.codeproject.com/Articles/708670/Part-3-Windows-Debugging-Techniques-Debugging-Appl to understand how to create dumps automatically.
History
- 2014-01-08: Article upload
- 2014-01-20: updated with links to other parts
