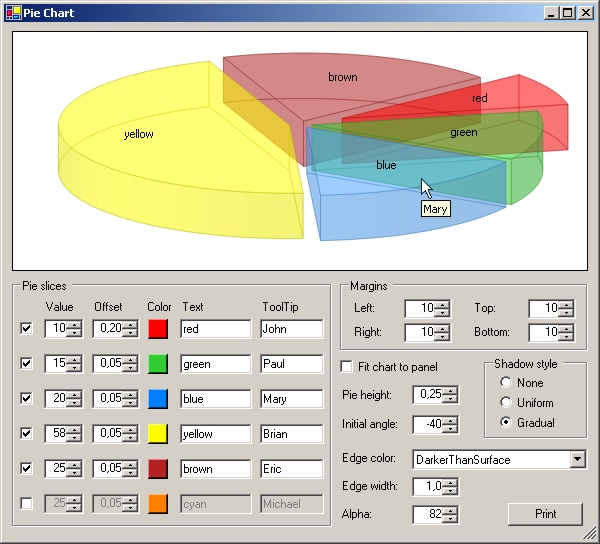
Introduction
The initial idea was to create a utility class / class library that could be used for drawing 3-D pie charts. At first, this seemed quite simple, since there is a DrawPie method already available in the Graphics class. This method accepts start angle and sweep angle as arguments, so it should not be a problem to use it: just sum up all values and then calculate the portion for each one, converting it to sweep angle for the corresponding pie slice. And this works for a circular chart. However, if you want to add 3-D perspective (i.e., if a chart is drawn with an ellipse shape), this approach will result in an impression of varying values, as demonstrated in the figure below: pie slices at the left and right side appear larger than those up and down, although all of them have the same sweep angle.
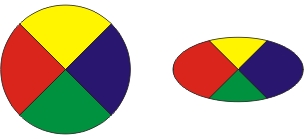
Instead of a direct insertion of the sweep angle, the parametric equation for ellipse has to be used.
The above problem thus solved, adding a real 3-D look to the chart requires only one additional step: drawing a cylinder brink. However, if you want to draw pie slices displaced from the common center, then the slice cut sides become visible and have to be drawn too. Since these sides may partially overlap, the order of drawing is of utmost importance to obtain the correct 3-D appearance.
Background
Drawing
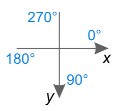
First, note that the coordinate system as shown in the figure below is used:
The parametric equation of ellipse has a form of:
x = a * cos(t)
y = b * sin(t)
where a and b are major and minor semi-axis, respectively, and t is a variable parameter. Note that t does not have direct interpretation in terms of an angle but (as anyone familiar with trigonometry will conclude from the figure below) can be related to the polar angle from the ellipse center as:
angle = tan-1(y/x) = tan-1((b * sin(t)) / (a * cos(t)))
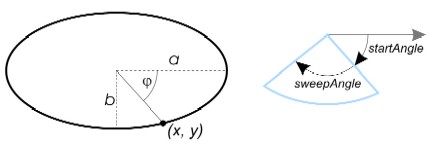
Consequently, when initializing individual shapes for rendering, the corresponding start and sweep angles have to be transformed by the following method:
protected float TransformAngle(float angle) {
  double x = m_boundingRectangle.Width * Math.Cos(angle * Math.PI / 180);
  double y = m_boundingRectangle.Height * Math.Sin(angle * Math.PI / 180);
  float result = (float)(Math.Atan2(y, x) * 180 / Math.PI);
  if (result < 0)
    return result + 360;
  return result;
}
In the above method, m_boundingRectangle is the boundary rectangle of the ellipse from which the pie shape is cut out. The width and height of this rectangle are equal to the major and minor axes of the ellipse, respectively.
When drawing a 3-D pie slice (with some finite height), it is necessary to draw the slice cut sides as well as the outer periphery of the cylinder from which the slice is cut out. For this, the center point and the points on the pie slice periphery (m_center, m_pointStart and m_pointEnd private members of the PieSlice class) and their corresponding siblings on the slice bottom side have to be calculated first. These points are used to constitute GraphicsPaths: paths for cut sides consist of four lines, while the path for the cylinder periphery consists of two vertical lines and two arcs.
It is worthy to note that the slice side corresponding to the start angle is visible only when the start angle is larger than 90 and less than 270 degrees, while the side corresponding to the end angle is visible only when the angle is between 270 and 90 degrees. Also, the cylinder brink is visible only for angles between 0 and 180 degrees.
As already mentioned, the drawing order is important when the chart contains several slices displaced from the center. The pie shape that is crossing the 270 degrees boundary must be drawn first because it may be (partially) covered by another pie slice. The slice closest to the 270 degrees axis (regardless if it is from the left or the right side) is drawn next, the procedure being repeated for the slices to follow.
To achieve this order, the pie slices are stored into an array starting with the shape that crosses the 270 degrees axis. Consequently, neighboring shapes will be placed in the second and in the last position of the array. Therefore, the search for the next shape to be drawn goes from the start and from the end of the list simultaneously, selecting the shape which is closer to the 270 degrees axis to be drawn first.
Pie slices crossing the 270 degrees axis have a unique feature: both cut sides (corresponding to the start and the end angle) are visible - c.f. figure below left. Moreover, if both the start and the end angles are within 0 and 180 degrees range, the slice will have its cylinder brink consisting of two parts (figure below right). To handle this, the slice is split into two sub-slices in the course of drawing, with the common top side.

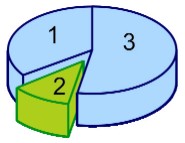
This splitting comes into play with drawing charts like the one shown below: if the blue slice was drawn first and completely, the green slice would completely overlap it, resulting in an irregular illusion. The numbers on each shape indicate the correct order of drawing.
Hit Testing
When the first version of the article was published, several readers suggested to add tool tips and pie slice highlighting when the mouse is over it. This feature has been implemented in version 1.1.
The main problem was to find and implement the algorithm that searches for the pie slice currently under the mouse cursor. The search order for the entire chart is the reverse of the drawing order, starting from the foremost slice. However, processing of individual slices is cumbersome because of their irregular shapes.
To test if a pie is hit, the pie slice shape has to be decomposed into several surfaces as shown on the figure below, and each of these surfaces is tested if it contains the hit point.

Note that the cylinder outer periphery hitting is not tested directly (in fact, I have no idea how it could be done simply), but is covered by testing the top (1) and the bottom (2) pie surfaces and the quadrilateral defined by the periphery points (3).
Hit testing for the top and bottom slice surfaces is straightforward - the distance of the point from the center of the ellipse is compared to the ellipse radius for the corresponding angle:
private bool PieSliceContainsPoint(PointF point,
float xBoundingRectangle, float yBoundingRectangle,
float widthBoundingRectangle, float heightBoundingRectangle,
float startAngle, float sweepAngle) {
double a = widthBoundingRectangle / 2;
double b = heightBoundingRectangle / 2;
double x = point.X - xBoundingRectangle - a;
double y = point.Y - yBoundingRectangle - b;
double angle = Math.Atan2(y, x);
if (angle < 0)
angle += 2 * Math.PI;
double angleDegrees = angle * 180 / Math.PI;
if (angleDegrees >= startAngle &&
angleDegrees <= startAngle + sweepAngle) {
double r = Math.Sqrt(y * y + x * x);
double a2 = a * a;
double b2 = b * b;
double cosFi = Math.Cos(angle);
double sinFi = Math.Sin(angle);
double ellipseRadius =
(b * a) / Math.Sqrt(b2 * cosFi * cosFi + a2 * sinFi * sinFi);
return ellipseRadius > r;
}
return false;
}
For quadrilaterals, a well know algorithm for testing if a point is inside a polygon is used: a ray is traced from the point to test and the number of intersections of this ray with the polygon is counted. If the number is odd, the point is inside the polygon, if it is even, the point is outside (c.f. figure below).
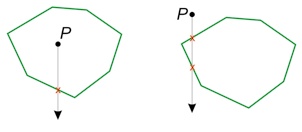
Consequently, all polygon sections are passed, counting intersections with the ray:
public bool Contains(PointF point, PointF[] cornerPoints) {
  int intersections = 0;
  float x0 = point.X;
  float y0 = point.Y;
  for (int i = 1; i < cornerPoints.Length; ++i) {
    if (DoesIntersect(point, cornerPoints[i], cornerPoints[i - 1]))
      ++intersections;
  }
  if (DoesIntersect(point, cornerPoints[cornerPoints.Length - 1],
                                                cornerPoints[0]))
    ++intersections;
  return (intersections % 2 != 0);
}

private bool DoesIntersect(PointF point, PointF point1, PointF point2) {
  float x2 = point2.X;
  float y2 = point2.Y;
  float x1 = point1.X;
  float y1 = point1.Y;
  if ((x2 < point.X && x1 >= point.X) ||
      (x2 >= point.X && x1 < point.X)) {

      float y = (y2 - y1) / (x2 - x1) * (point.X - x1) + y1;
      return y > point.Y;
  }
  return false;
}
Using the Code
The PieChart solution contains three classes: PieSlice, PieChart3D and PieChartControl (derived from the System.Windows.Forms.Panel control). The PieSlice class provides all the functionality required to draw a 3-D pie slice with given a start and sweep angle, color, height and shadow style.
The PieChart3D represents the entire chart. There are several constructors available, all of them taking a bounding rectangle and an array of values. Some constructors also accept:
- array of colors used to represent values
- array of slice displacements
- slice thickness
Slice displacement is expressed as a ratio of the slice "depth" and ellipse radius; minimum value of 0 means that there is no displacement, while 1 (largest allowed value) means that the shape is completely taken out of the ellipse.
Slice thickness represents the ratio of pie slice thickness and the ellipse's vertical, minor axis; largest allowed value being 0.5.
It is also possible to set any of the above parameters using public properties. Note that if the number of colors provided is less than the number of values, colors will be re-used. Similarly, if the number of displacements is exhausted, the last displacement will be used for all the remaining pie slices.
There are also additional public properties that can be set:
Texts,FontForeColorShadowStyleEdgeColorTypeEdgeLineWidthInitialAngleFitToBoundingRectangle
The meaning of all these properties and their possible values can be seen from the demo sample. The Texts property is an array of strings that are displayed on corresponding slices. Default implementation places text near the center of the slice's top, but the user may override the PlaceTexts method of the PieChart3D class to implement her/his own placement logic. Font and ForeColor properties define the font and the color that is used to display these texts.
The PieChart3D class can be used for printing: it is only necessary to initialize the chart object and then call its Draw method, providing the corresponding Graphics object:
public void Draw(Graphics graphics) { ... }
To display the chart on the screen, PieChartControl is more appropriate: it encapsulates the chart into a panel that is responsible for chart (re)painting. The user only has to place it on the form and set the required values. For example:
private System.Drawing.PieChart.PieChartControl panelDrawing =
  new System.Drawing.PieChart.PieChartControl();
panelDrawing.Values = new decimal[] { 10, 15, 5, 35};
int alpha = 80;
panelDrawing.Colors = new Color[] { Color.FromArgb(alpha, Color.Red),
                                    Color.FromArgb(alpha, Color.Green),
                                    Color.FromArgb(alpha, Color.Yellow),
                                    Color.FromArgb(alpha, Color.Blue) };
panelDrawing.SliceRelativeDisplacements = new float[] { 0.1F, 0.2F, 0.2F, 0.2F };
panelDrawing.Texts = new string[] { "red",
                                    "green",
                                    "blue",
                                    "yellow" };
panelDrawing.ToolTips = new string[] { "Peter",
                                       "Paul",
                                       "Mary",
                                       "Brian" };
panelDrawing.Font = new Font("Arial", 10F);
panelDrawing.ForeColor = SystemColors.WindowText
panelDrawing.LeftMargin = 10F;
panelDrawing.RightMargin = 10F;
panelDrawing.TopMargin = 10F;
panelDrawing.BottomMargin = 10F;
panelDrawing.SliceRelativeHeight = 0.25F;
panelDrawing.InitialAngle = -90F;
PieChartControl overrides both OnPaint and OnResize events, taking care of correct chart redrawing.
Note that PieChartControl has an additional ToolTips property accepting an array of strings that are displayed when the corresponding pie slice is hit. If any string in this array is empty, the corresponding value will be displayed instead.
Points of Interest
To achieve a better 3-D perspective, I have introduced a "gradual" shadow, changing the brightness of the slice cut sides depending on their angles. To achieve this effect on the cylinder brink, a gradient fill is used for painting the periphery. I used an empirical formula for this. However, the user may change this by deriving a class from PieSlice and overriding the CreateBrushForSide and the CreateBrushForPeriphery methods in the PieSlice class, implementing her/his own logic.
Similarly, a user can override the CreatePieSliceHighlighted method in the PieChart class; the default implementation draws the highlighted pie slice in a slightly lighter color.
From version 1.4, a simple pie chart printing is included in the demo program; the user just has to click the Print button on the demo form. The printing code is provided in the PrintChart class of the Test project.
Copyright Notice
You are free to use this code and the accompanying DLL. Please include a reference to this web page in the list of credits.
History
- 1st June, 2004 - Initial submission of the article
- 22nd June, 2004 - ver. 1.1: Tooltip and pie slice highlighting added. Also (credits for these go to Andreas Krohn), flickering on resize has been removed and assertion failure bug when control is made very small has been fixed.
- 11th November, 2004 - ver. 1.2: bug fixes
- 21st March, 2005 - ver. 1.3: color transparency support added (thanks to Bogdan Pietroiu for this suggestion), and description text for each slice (as suggested by ccarlinx) added.
- 10th November, 2005 - ver. 1.4: Pie chart control crashing for angle of 270 degrees bug (found by gabbyr and rafabgood) and "Crash when all slices have 0 value" has been fixed. A simple pie chart printing sample has been included into the demo project (please note that the quality of the printout depends on the capabilities of the printer and is usually far behind the screen display quality).
- 12th March, 2006 - ver. 1.5: Control crashing bug (as noticed by jianingy) has been fixed.
