Recently I was poking around a bit with the interceptors available in EF 6, IDbConnectionInterceptor and IDbCommandInterceptor. Since a common use of these interceptors is to provide logging/profiling capabilities, it seemed like these might be a good fit to try with ETW. But first I wanted to know if EF already uses ETW. After a somewhat lengthy search it seems that it does not, although at the provider and SQL Server levels there is use of something called BID (Built In Diagnostics), along with complicated directions involving registering MOF files, which I won’t try now.
I decided to re-work the Microsoft sample “ASP.NET MVC Application Using Entiy Framework Code First” as it’s using EF 6 and has already implemented a DbCommandInterceptor for logging. It also has a simple ILogger implementation. The name of the sample application is, of course, “ContosoUniversity”. You can download the modified source code here.
Getting Started
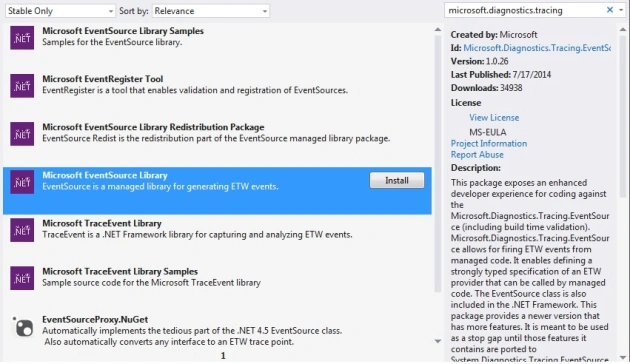
To add to some of the confusion about providers, Microsoft offers two different implementations of EventSource. First there’s System.Diagnostics.Tracing.EventSource, in mscorlib, then there’s Microsoft.Diagnostics.Tracing.EventSource, available from a NuGet package. What’s the difference? The NuGet version (MDT.EventSource) supports channels, and thus writing to the Event Log. The package will also be revved more frequently, and includes support for portable, Windows Store and Phone apps, so is probably the best choice (despite what the package description says).

The package also installs the EventRegister package, which adds a target to your project file to validate your EventSource and generate and register a manifest if needed (this is needed if using channels, which I won’t get into here). The package adds a document called _EventSourceUsersGuide.docx to your project which is worth reading. You can also find it online.
A simple EventSource
An EventSource definition is initially deceptively easy.
The sample already includes a DbCommandInterceptor implementation called SchoolInterceptorLogging, which is doing logging for executing/executed interception of three types of DbCommands – Scalar, NonQuery, and Reader.
Note: The Microsoft sample has a bug in its implementation of the command interceptor. Only a single instance of the interceptor is used by EF, so it must be thread safe to handle concurrent requests from multiple threads. The Stopwatch used in the sample is not thread safe.
For logging purposes I don’t really care about the type of DbCommand, so my EventSource will define only two events – CommandExecuting and CommandExecuted, and the interceptor will call these event methods.
The interceptor now looks like this:
public class SchoolInterceptorLogging : DbCommandInterceptor {
...
public override void ReaderExecuting(DbCommand command, DbCommandInterceptionContext<DbDataReader> interceptionContext) {
SampleEventSource.Log.CommandExecuting(command.CommandText);
}
public override void ReaderExecuted(DbCommand command, DbCommandInterceptionContext<DbDataReader> interceptionContext) {
SampleEventSource.Log.CommandExecuted(command.CommandText);
}
}
… while the first attempt at an EventSource looks like this:
using Microsoft.Diagnostics.Tracing;

namespace ContosoUniversity.Logging {

  [EventSource(Name="Samples-ContosoUniversity")]
  public sealed class SampleEventSource : EventSource {

    public static readonly SampleEventSource Log = new SampleEventSource();

    public class Tasks {
      public const EventTask CommandExecuting = (EventTask)0x1;
    }

    private const int CommandStartEventId = 1;
    private const int CommandStopEventId = 2;

    [Event(CommandStartEventId, Task=Tasks.CommandExecuting, Opcode=EventOpcode.Start)]
    public void CommandExecuting(string commandText) {
      if (IsEnabled()) WriteEvent(CommandStartEventId, commandText);
    }

    [Event(CommandStopEventId, Task=Tasks.CommandExecuting, Opcode=EventOpcode.Stop)]
    public void CommandExecuted(string commandText) {
      if (IsEnabled()) WriteEvent(CommandStopEventId, commandText);
    }
  }
}
A few things to note:
- An ETW provider is defined by sub-typing EventSource. The class must be sealed, and should not implement any interfaces. The EventSourceAttribute is used to name the provider, otherwise it will default to the class name.
- Microsoft guidance suggests you define a singleton instance of your EventSource; using a static field named “Log” seems to be common practice.
- Any void instance methods are assumed to be events, with event ids incrementing by one. To avoid problems it’s a good idea to use the EventAttribute on all event methods and explicitly define the parameters as shown here. Event methods can take only string, DateTime or primitive type arguments, which means you can’t pass a type such as Exception or DbCommand to an event method, as the build-time validation will raise an error. The number and types of arguments to the event method must also match those passed to the WriteEvent method it calls.
Consuming events
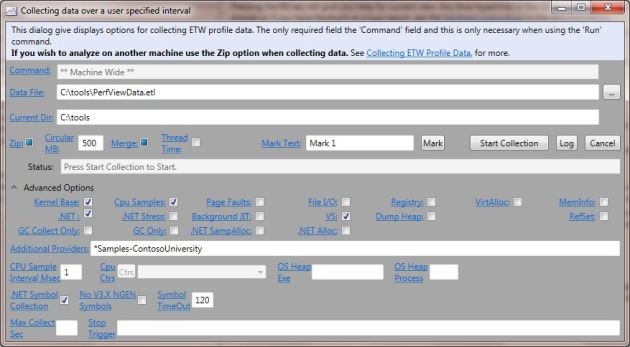
Generating events is all well and good, but it’s still nice to see what’s going on while debugging. PerfView to the rescue! PerfView is a “performance analysis tool focusing on ETW information” and has a huge number of features, but with the help of Vance Morrison’s PerfView tutorial video series it’s easy to get started. I wanted to view my custom events, so I started a data collection and told PerfView about my custom provider:

Because this provider isn’t registered on the machine with a manifest the provider name must be prefixed with an asterisk as shown above. Not all tools support this.
After running the application for a few minutes before stopping the collection, I can now see my events in the context of .NET and other provider events. Here’s a few of my events, with the DURATION_MSEC calculated by PerfView.

Using an external tool is great for working with a deployed app, but while coding and debugging it’s much handier to see a real time log of events. After removing the prior Logger implementation it may seem a bit ass backwards to add logging back in, but that’s what I do using an EventListener. The EventListener is part of the EventSource NuGet package, and can listen to all EventSources in the current domain.
Here’s a simple implementation which dumps everything to the output window in Visual Studio:
using Microsoft.Diagnostics.Tracing;
using System.Diagnostics;
using System.Linq;

namespace ContosoUniversity.Logging {

  public class SampleEventListener : EventListener {

    protected override void OnEventSourceCreated(EventSource eventSource) {
      EnableEvents(eventSource, EventLevel.LogAlways, EventKeywords.All);
      Trace.TraceInformation("Listening on " + eventSource.Name);
    }

    protected override void OnEventWritten(EventWrittenEventArgs eventData) {
      string msg1 = string.Format("Event {0} from {1} level={2} opcode={3} at {4:HH:mm:ss.fff}",
        eventData.EventId, eventData.EventSource.Name, eventData.Level, eventData.Opcode, DateTime.Now);

      string msg2 = null;
      if (eventData.Message != null) {
        msg2 = string.Format(eventData.Message, eventData.Payload.ToArray());
      } else {
        string[] sargs = eventData.Payload != null ? eventData.Payload.Select(o => o.ToString()).ToArray() : null;
        msg2 = string.Format("({0}).", sargs != null ? string.Join(", ", sargs) : "");
      }

      if (eventData.Level == EventLevel.Error || eventData.Level == EventLevel.Critical) {
        Trace.TraceError("{0}\n{1}", msg1, msg2);
      } else {
        Trace.TraceInformation("{0}\n{1}", msg1, msg2);
      }
    }
  }
}
This is a start, but I’ve lost a few things too. The original sample logged informational messages, warnings, errors and “trace api” information, along with it’s own duration calculation (however buggy). This implementation doesn’t log exceptions, and the EventListener doesn’t contain event names or timestamps.
Logging exceptions
Because System.Exception and sub-types aren’t supported with EventSource event methods you must apparently resort to using either the exception message or ToString(), which doesn’t seem ideal. CLR exceptions are logged by the CLR Runtime ETW provider, so they aren’t lost entirely, but logging them from my EventSource seems like a good idea too, so I added a Failure event to my EventSource. (Why did I call it “Failure”? I don’t know, it seemed like a good idea at the time, and naming things is hard.)
[Event(FailureEventId, Message = "Application Exception in {0}: {1}", Level = EventLevel.Error)]
public void Failure(string methodName, string message) {
  if (this.IsEnabled()) {
    this.WriteEvent(FailureEventId, methodName, message);
  }
}
… and this to the *Executed methods in the interceptor:
public override void ReaderExecuted(DbCommand command, DbCommandInterceptionContext<DbDataReader> interceptionContext) {
  LogResultOrException(command, interceptionContext.Exception);
}

private void LogResultOrException(DbCommand command, Exception ex, [CallerMemberName] string methodName = "") {
  if (ex != null) {
    SampleEventSource.Log.Failure(methodName, ex.ToString());
  } else {
    SampleEventSource.Log.CommandExecuted(command.CommandText);
  }
}
Not ideal, but better. I want to use ETW instrumentation throughout the sample application, though, not just to record database calls, so back to design considerations.
Adding more events
The Microsoft recommendation is to limit the number of EventSources defined within your application. But this raises more questions – if only a single EventSource is used for the entire application, and you want to take advantage of the structured nature of ETW events, you could have a large number of events defined within a single provider. If instead you use “generic” events such as Information(..), Warning(..) and so on, you lose the benefits of strong typing. The goal, after all, is to enable a comprehensive analysis of the application in context, not to generate lots of string messages that can’t be filtered easily.
The user’s guide installed with the NuGet package recommends a “{CompanyName}{Product}{Component}” naming convention (which I didn’t follow here), but this sample is too small to have components, and was actually only logging from its DbInterceptors, so I need to think about what might be useful to instrument to diagnose production issues. Since the application is pretty simple, the only potentially helpful thing I can see is to optionally instrument method entry and exit, in either selected “critical” methods or all methods in certain classes. This sounds like a great use case for AOP, and in a later post I’m going to try implementing this with ETW and PostSharp.
For now, though, I’ll just add another EF interceptor, IDbConnectionInterceptor, and add some more events to my existing EventSource. This will give me a chance to work with the additional EventAttribute parameters:

Kathleen Dollard has a good post explaining how to best use these parameters, but here’s some quick definitions:
Channel – There are four predefined channels – Admin, Analytic, Debug and Operational. Other than being used to write to the EventL Log, I still don’t understand much about them. In a later post I’ll look at this further.
Keywords – These can be used to help group or categorize events.
Level – Predefined levels include Informational, Warning, Error, Critical, LogAlways and Verbose.
Message – This is an optional format string which accepts the event method parameters.
Task and Opcode – Provide for “task-oriented” groupings. The Opcode can only be used if a Task is specified. There are some predefined Opcodes like Start and Stop, Suspend and Resume, and a few others. Because they’re well-known, tools can act on these opcodes in a generic way.
Version – Events can be versioned, but according to Dollard, don’t.
The IDbConnectionInterceptor interface contains begin/end interception points for 12 different connection-related events, but for now I’m only interested in instrumenting those related to opening and closing a connection.
Here’s the revised EventSource. It contains several more event methods, a few more tasks, and keywords, which may help in filtering. A few of the events also use either the Verbose or Error level.
using Microsoft.Diagnostics.Tracing;
using System.Runtime.CompilerServices;

namespace ContosoUniversity.Logging {

  [EventSource(Name="Samples-ContosoUniversity")]
  public sealed class SampleEventSource : EventSource {

    public static readonly SampleEventSource Log = new SampleEventSource();

    public class Keywords {
      public const EventKeywords Command = (EventKeywords)1;
      public const EventKeywords Connection = (EventKeywords)2;
    }

    public class Tasks {
      public const EventTask CommandExecuting = (EventTask)0x1;
      public const EventTask ConnectionOpening = (EventTask)0x2;
      public const EventTask ConnectionClosing = (EventTask)0x3;
    }

    private const int CommandStartEventId = 1;
    private const int CommandStopEventId = 2;
    private const int ConnectionOpenStartEventId = 3;
    private const int ConnectionOpenStopEventId = 4;
    private const int ConnectionCloseStartEventId = 5;
    private const int ConnectionCloseStopEventId = 6;
    private const int TraceApiEventId = 50;
    private const int CommandFailureEventId = 1000;
    private const int ConnectionFailureEventId = 1001;

    [Event(CommandStartEventId, Keywords=Keywords.Command, Task=Tasks.CommandExecuting, Opcode=EventOpcode.Start, Level = EventLevel.Verbose)]
    public void CommandExecuting(string commandText) {
      if (IsEnabled()) WriteEvent(CommandStartEventId, commandText);
    }

    [Event(CommandStopEventId, Keywords = Keywords.Command, Task = Tasks.CommandExecuting, Opcode = EventOpcode.Stop)]
    public void CommandExecuted(string commandText) {
      if (IsEnabled()) WriteEvent(CommandStopEventId, commandText);
    }

    [Event(ConnectionOpenStartEventId, Message = "Opening {0}", Keywords = Keywords.Connection, Task = Tasks.ConnectionOpening, Opcode = EventOpcode.Start)]
    public void ConnectionOpening(string databaseName) {
      if (IsEnabled()) WriteEvent(ConnectionOpenStartEventId, databaseName);
    }

    [Event(ConnectionOpenStopEventId, Message = "Opened {0}", Keywords = Keywords.Connection, Task = Tasks.ConnectionOpening, Opcode = EventOpcode.Stop)]
    public void ConnectionOpened(string databaseName) {
      if (IsEnabled()) WriteEvent(ConnectionOpenStopEventId, databaseName);
    }

    [Event(ConnectionCloseStartEventId, Message = "Closing {0}", Keywords = Keywords.Connection, Task = Tasks.ConnectionClosing, Opcode = EventOpcode.Start)]
    public void ConnectionClosing(string databaseName) {
      if (IsEnabled()) WriteEvent(ConnectionCloseStartEventId, databaseName);
    }

    [Event(ConnectionCloseStopEventId, Message = "Closed {0}", Keywords = Keywords.Connection, Task = Tasks.ConnectionClosing, Opcode = EventOpcode.Stop)]
    public void ConnectionClosed(string databaseName) {
      if (IsEnabled()) WriteEvent(ConnectionCloseStopEventId, databaseName);
    }

    [Event(TraceApiEventId, Message = "TraceApi {0} {1}", Level = EventLevel.Verbose)]
    public void TraceAPI([CallerMemberName] string methodName = "", string message = "") {
      if (this.IsEnabled()) this.WriteEvent(TraceApiEventId, methodName, message);
    }

    [Event(CommandFailureEventId, Message = "Command error in {0}: {1}", Keywords = Keywords.Command, Level = EventLevel.Error)]
    public void CommandFailure(string methodName, string message) {
      if (this.IsEnabled()) this.WriteEvent(CommandFailureEventId, methodName, message);
    }

    [Event(ConnectionFailureEventId, Message = "Connection error in {0}: {1}", Keywords = Keywords.Connection, Level = EventLevel.Critical)]
    public void ConnectionFailure(string methodName, string message) {
      if (this.IsEnabled()) this.WriteEvent(ConnectionFailureEventId, methodName, message);
    }
  }
}
And the new interceptor:
using ContosoUniversity.Logging;
using System;
using System.Data.Common;
using System.Data.Entity.Infrastructure.Interception;
using System.Runtime.CompilerServices;
namespace ContosoUniversity.DAL {
public class SchoolConnectionInterceptor : IDbConnectionInterceptor {
private SampleEventSource _logger = SampleEventSource.Log;
public void Opening(DbConnection connection, DbConnectionInterceptionContext interceptionContext) {
_logger.ConnectionOpening(connection.Database);
}
public void Opened(DbConnection connection, DbConnectionInterceptionContext interceptionContext) {
LogResultOrException(() => _logger.ConnectionOpened(connection.Database), interceptionContext);
}
public void Closing(DbConnection connection, DbConnectionInterceptionContext interceptionContext) {
_logger.ConnectionClosing(connection.Database);
}
public void Closed(DbConnection connection, DbConnectionInterceptionContext interceptionContext) {
LogResultOrException(() => _logger.ConnectionClosed(connection.Database), interceptionContext);
}
public void Disposing(DbConnection connection, DbConnectionInterceptionContext interceptionContext) {
_logger.TraceAPI();
}
public void Disposed(DbConnection connection, DbConnectionInterceptionContext interceptionContext) {
_logger.TraceAPI();
}
private void LogResultOrException(Action logAction, DbConnectionInterceptionContext context, [CallerMemberName] string methodName = "") {
if (context.Exception != null) {
_logger.ConnectionFailure(methodName, context.Exception.ToString());
} else {
logAction();
}
}
}
}
Is Less More?
For simple instrumentation from only the EF interceptors this isn’t too bad, but I’m still not happy with the tight coupling, and also don’t have a handle on what would be most useful for monitoring a running production application. In fact, I wonder if I’d get equivalent results if I got rid of the interceptors and called one generic trace event via built-in EF logging:
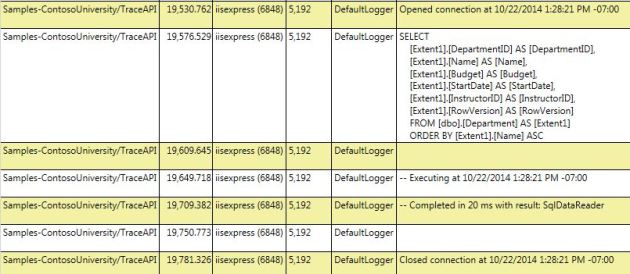
this.Database.Log = (s) => SampleEventSource.Log.TraceAPI("DefaultLogger", s);
Which results in somewhat unstructured but still useful information:

And finally …
It’s going to take some trial and error to get this right; after several weeks I’ve still only scratched the surface with ETW and find the learning curve long and sometimes steep. In future posts I plan to take a look at:
- channels and the Event Log,
- the Semantic Logging Application Block,
- AOP for method enter/exit instrumentation
CodeProject
Filed under: c# Tagged: EntityFramework, etw, EventListener, EventSource 


