Issues that (appear to) occur only in production can be very frustrating. Recently, I've had difficulty with a ‘normal’ product upgrade introducing several features and fixes… the code base worked in development, passed QA and passed UAT in the staging environment.
However, 5 minutes after deploying to live, the w3wp process crashes, shortly followed by the other servers in the cluster.
Bugger.
A quick look in the event logs show no unusual errors logged by the application, but the Application log records this:
Faulting application w3wp.exe, version 7.0.6002.18005, time stamp 0x49e023cf,
faulting module kernel32.dll, version 6.0.6002.18005, time stamp 0x49e037dd,
exception code 0xe053534f, fault offset 0x0003fbae, process id 0x%9,
application start time 0x%10.
Fecking awesome, no quick fix help here. After rolling the site back to the previous version, a bit of Googling reveals that exception code 0xe053534f (catchy) is a StackOverflowException.
This is one of those lovely exceptions (like OutOfMemoryException) which you can’t really recover from (or indeed catch!), as the CLR will simply halt executing any of your code whilst it cleans up the mess and then roll over and die.
What I need is something that can detect the error, stop the CLR, and give me a ice cube in hell’s chance of seeing what’s up. What I need is a debugger.
But You Can’t Hook Up VS to a Production Website!
If this was happening on my local environment, VS was clearly the tool of choice. But for hermetically-sealed, locked down environments like Production – Remote Debugging just ain’t gonna happen.
Shockingly, it seems I’m not the only (or even the first) developer to have deployed code with a bug in. Fortunately, this means there’s already some tools out there to help, enter DebugDiag.
First, a bit of preparation… I pick a sacrificial server to host the debugger process and the faulty code and remove it from the public facing cluster.
After installing and running the app, you’re faced with a simple wizard for defining what you want to hook into:
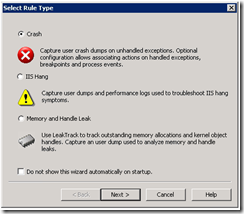
It’s pretty self-explanatory. You pick from Crash (App be Bust), IIS Hang (Web App be Slow) or Memory and Handle Leak (App be Greedy).
I’ll be wanting ‘Crash’.
Next, you need to pick what you’re trying to debug:
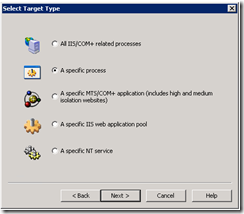
Again, it’s pretty obvious. As I’m not looking to borrow trouble from other applications, I’m just interesting in what’s going wrong with w3wp. So ‘A Specific Process’ it is.
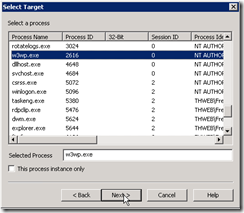
Selecting the Process Name ‘w3wp.exe’ means that debugger will hook into any and all w3wp processes that it can find. Checking the ‘This process instance only’ will limit it to just that Process ID (I don’t want this).
And now for ‘Advance Configuration’
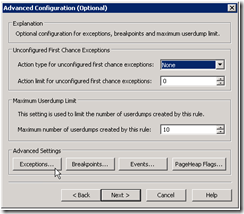
If I just wanted to capture a dump when a crash occurs, I could just click ‘Next’. But right now I’m after a specific exception (0xe053534f). If the application crashes after that’s sorted, then I’ll just have to repeat the process. So click the ‘Exceptions’ button:
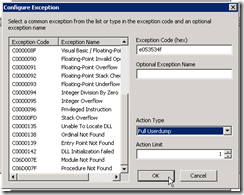
Now, it’s just a case of filling in the Hex Error Code from the Application Log (e053534f) and selecting ‘Full Userdump’ and set the Action Limit to ‘1’. This will halt the process when the first matching exception is recorded and grab everything it can, ready for diagnosis.
There aren’t any more exceptions that I want to add, so I can just continue through the wizard and save the rule when prompted (taking a note of where the logs will be stored):
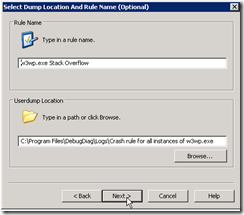
And Activate the rule.
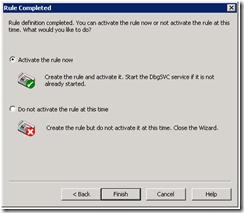
Now for the bit I hope the client never finds out about….knowingly exposing the public to faulty code!
In order to identify the issue, I need to capture the event. So, with the rule active in DebugDiag, I re-add the sacrificial server back to the public facing cluster and wait for the error to occur…
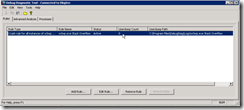
Thankfully, it’s simply a case of monitoring the Userdump count for the rule on the DebugDiag window. When that hits 1, I can remove the server from the cluster again.
Analysing the Crash Dump and Identifying the Issue
Ok, I’ve captured the exception and dropped the sacrificial server from the cluster again and transferred the dump to my development machine. Let’s take a look at what DebugDiag found.
Switch to the ‘Advanced Analysis’ tab, select the ‘Crash/Hang Analyzers’ script and the dump data file and click ‘Start Analysis’.
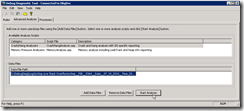
After a few seconds, an Internet Explorer window pops up with the findings:
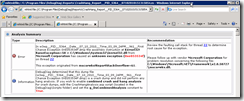
Errrk, the recommendation mentions a fault with mscorwks.dll. Not to worry, I happen to know that all Out of Memory and Stack Overflow originate from this library… it’s where they’re detected and raised! Not the root cause, for that I need to look further into the stacktrace:
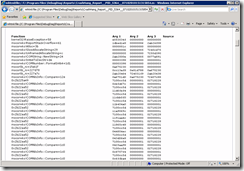
Wow, a crystal clear view of what was occurring on the thread when the stack overflow occurred – if you’re a sodding machine. This is the native code view of the compiled managed code, so it’s been doubly mangled. I need a translator….WinDbg.
So, open the DebugDiag crash dump in WinDbg:
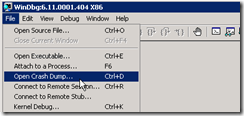
And you’ll get a nice little terminal window:
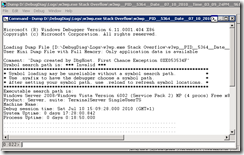
All very well and good, but not exactly helpful. So we need to tell it to analyse the dump with its .NET goggles on. This can be done by entering these commands into the command line at the bottom of the screen:
- .loadby sos mscorwks
- !clrstack
This should now give a much more readable and understandable stack trace:
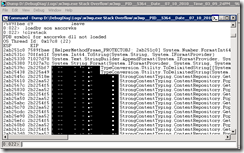
(Code blacked out to protect the guilty…even if it is me!)
By reviewing the stack trace, you should be able to work out the code that’s trapped in a recursive loop (a repeating set of lines towards the top) and also its entry point (towards the bottom).
Now it’s back to the usual replicate/fix/test bug fixing process.
