Introduction
Although the .NET Framework provides usage of performance counters under the System.Diagnostics namespace, for some reason, documentation on it does little cover using performance counters for average duration per execution. When starting using PerformanceCounterType.AverageTimer32, performance monitor did not show the expected results.
I started to dig into CodeProject and some newsgroups, and found many articles covering the same problem. After I found the solution, I started to write an article, which introduces using performance counters in .NET and especially how to use AverageTimer32 performance counter. So here it is!
I am sorry, that I only have German Windows editions, so the images contained in the article contain German names for buttons, etc. I tried to find the correct translation to English, but I am not quite sure if they are accurate. Maybe somebody can help me out with images of English versions, so that I can provide them here.
Getting started
Performance counters can monitor system components such as processors, memory, and network I/O. If you use performance counters in your application, they can publish performance-related data to compare them against acceptable criteria. Performance counters are available on Microsoft operating systems Windows 2000 and later.
Performance counters can be made visible using the Performance monitor (perfmon.exe). Later, I will show how to add and remove performance counters in the Performance monitor.
Performance Counter Types
Different performance counter types are available, covering different performance interests. They range from counts to those which calculate averages. Some of the performance counter types are for special situations only, but the following list contains the most common types you will normally use - and this article is covering:
NumberOfItems32 - a counter that counts the number of items. You can use it to calculate how often an operation was performed or to count the total number of items you processed.
RateOfCountsPerSecond32 - a counter that tracks down the number of items or operations per second.
AverageTimer32 - a counter that measures the average time required to perform an operation. The counter is calculated by the ratio of the total time elapsed and the number of items completed during that time. This comes along with ...
AverageBase - the base counter for AverageTimer32 which counts the number of items completed during the elapsed time.
You will find the performance counter types in the System.Diagnostics.PerformanceCounterType enumeration. Some of the counters found in that enumeration end with "Base" which indicates them as supporting counters for other counters which perform calculations (such as AverageTimer32). Whenever you set up a counter that performs calculations, you'll need to set up a supporting "Base" - counter.
Categories, Counters And Instances
Performance counters are combined together under categories, such as Processor or Memory. A category catalogues performance counters in a logical unit. A performance counter itself can be divided into instances, such as processes, threads, or physical units.
Example
When monitoring the processor load a process takes while execution, you will find the performance counter % Processor time in the category Processor. Underneath that counter, you will find an instance for each process currently running on your system.
Creation And Setup Of Performance Counters
There are two ways to create performance counters. You can either create them using the Server-Explorer or create them programmatically by code. Creating performance counters using the Server-Explorer is much easier than doing it by code, but on production machines, you might not be able to install Visual Studio .NET to take advantage of this feature. However, I will explain both ways.
Creating Performance Counters Using Server-Explorer
The simplest way to set up performance categories and counters is by using Server-Explorer integrated within Visual Studio .NET. Normally, you will find it at left side toolbar where you also have your Toolbox for designing Windows Forms. If you don't see it, you might have closed it before. Then, direct to the "View" menu and select the "Server-Explorer" option.
Setting up new categories is pretty easy. Open the "Server-Explorer" and open the tree-node "Performance counters". The tree should open and you should see all performance categories currently available on your system (Figure 1).
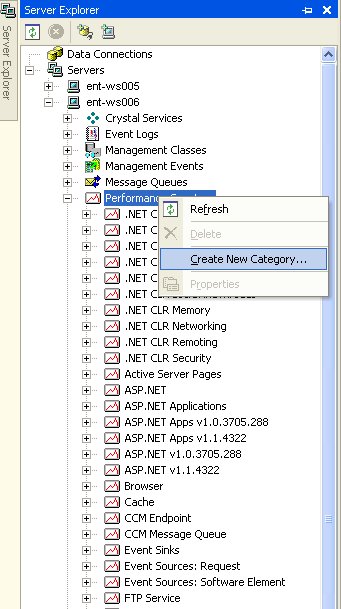
Figure 1
Now right-click on "Performance counters" and select "Add new category" to add a new category. Enter a name, a description, and some counters to it, and you're done. You can also right-click on a category and select "Show category" to add some more counters to any existing category (Figure 2).
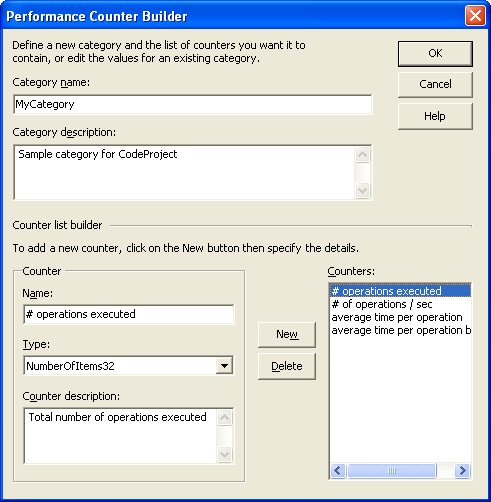
Figure 2
Performance Counter Installation By Code
Performance counters can be created manually at runtime by code. It takes much more effort to do so, but once you learn how, it is as simple as doing so by Server-Explorer. When creating performance counters and/or categories by code, you must take care, that the user running the code must have the proper administrative rights. This might be a problem when using performance counters in Web Applications because the ASP.NET user does not have them.
Installing performance counters programmatically includes using some classes from the System.Diagnostics namespace:
PerformanceCounterCategory - operations on a performance category (Create, Delete, Exists).
CounterCreationDataCollection - a collection class which is used to create counters for a category.
CounterCreationData - a class where you can define the shape (name, description and type) of your performance counters.
To create a new performance category which comes along with some counts, you will first create a System.Diagnostics.CounterCreationDataCollection to hold the information about the counters you want to create. Then you create for each counter, one System.Diagnostics.CounterCreationData instance, and add it to the collection. Use the System.Diagnostics.PerformanceCategory.Create method to create the category and all related counters stored in the collection.
Let's look at some code:
if (!PerformanceCounterCategory.Exists("MyCategory"))
{
CounterCreationDataCollection counters = new CounterCreationDataCollection();
CounterCreationData totalOps = new CounterCreationData();
totalOps.CounterName = "# operations executed";
totalOps.CounterHelp = "Total number of operations executed";
totalOps.CounterType = PerformanceCounterType.NumberOfItems32;
counters.Add(totalOps);
CounterCreationData opsPerSecond = new CounterCreationData();
opsPerSecond.CounterName = "# operations / sec";
opsPerSecond.CounterHelp = "Number of operations executed per second";
opsPerSecond.CounterType = PerformanceCounterType.RateOfCountsPerSecond32;
counters.Add(opsPerSecond);
CounterCreationData avgDuration = new CounterCreationData();
avgDuration.CounterName = "average time per operation";
avgDuration.CounterHelp = "Average duration per operation execution";
avgDuration.CounterType = PerformanceCounterType.AverageTimer32;
counters.Add(avgDuration);
CounterCreationData avgDurationBase = new CounterCreationData();
avgDurationBase.CounterName = "average time per operation base";
avgDurationBase.CounterHelp = "Average duration per operation execution base";
avgDurationBase.CounterType = PerformanceCounterType.AverageBase;
counters.Add(avgDurationBase);
PerformanceCounterCategory.Create("MyCategory",
"Sample category for Codeproject", counters);
}
Executing the code above creates a new performance category called "MyCategory" and adds some performance counters to it ("# operations executed", "# operations / sec", "average time per operation"). But you won't be able to change values of the counters yet. Open Server-Explorer and switch to "Performance counters". You will find the new category there and also the three new counters under that category. Maybe, you'll have to refresh the view by right-clicking "Performance counters" and selecting refresh to make the changes visible (Figure 3).
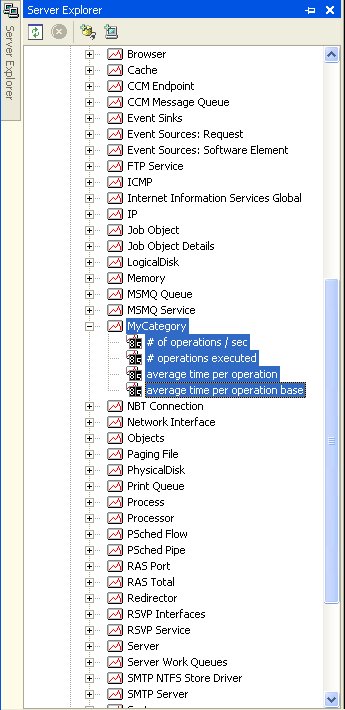
Figure 3
As I told before, creating counters which require some calculation requires a supporting base counter. The example above added only three counters to the category, but four CounterCreationData instances have been added to the CounterCreationDataCollection. If you take a closer look at it, you will see that the third instance is of type System.Diagnostics.PerformanceCounterType.AverageTimer32 (avgDuration) and the last instance is of type System.Diagnostics.PerformanceCounterType.AverageBase (avgDurationBase). avgDurationBase is the supporting counter for avgDuration. When monitoring performance later, you will see how both counters work together. It is important to know that the supporting counter always must follow the counter which will monitor performance!
To create a new category and add some performance counters to it, you must:
- See if the category already exists (
PerformanceCounterCategory.Exists()).
- Create a
CounterCreationDataCollection and add some CounterCreationData to it.
- Create the category (
PerformanceCategory.Create()).
Remember, you won't be able to create categories and/or counters that already exist!
Working With Performance Counters
After installing performance counters, you usually want to use them to monitor performance. Therefore, you can use the System.Diagnostics.PerformanceCounter class. The difference between System.Diagnostics.CounterCreationData and System.Diagnostics.PerformanceCounter is that System.Diagnostics.CounterCreationData physically adds a performance counter to a category on your local machine, while System.Diagnostics.PerformanceCounter is used to create an instance of a performance counter and to change performance values.
Create Performance Counters To Work With
Creating performance counters to work with is easy. Create a new instance of System.Diagnostics.PerformanceCounter and set the following properties properly:
CategoryName - the name of the category the counter belongs to.
CounterName - the name of the counter you want to create.
MachineName - the name of the machine the counter runs on ("." is the local machine).
ReadOnly - indicates if you only can read to a counter; as we want to write performance data, we mark it as false.
You can leave the other properties at its defaults as we don't require them to change now.
_TotalOperations = new PerformanceCounter();
_TotalOperations.CategoryName = "MyCategory";
_TotalOperations.CounterName = "# operations executed";
_TotalOperations.MachineName = ".";
_TotalOperations.ReadOnly = false;
_OperationsPerSecond = new PerformanceCounter();
_OperationsPerSecond.CategoryName = "MyCategory";
_OperationsPerSecond.CounterName = "# operations / sec";
_OperationsPerSecond.MachineName = ".";
_OperationsPerSecond.ReadOnly = false;
_AverageDuration = new PerformanceCounter();
_AverageDuration.CategoryName = "MyCategory";
_AverageDuration.CounterName = "average time per operation";
_AverageDuration.MachineName = ".";
_AverageDuration.ReadOnly = false;
_AverageDurationBase = new PerformanceCounter();
_AverageDurationBase.CategoryName = "MyCategory";
_AverageDurationBase.CounterName = "average time per operation base";
_AverageDurationBase.MachineName = ".";
_AverageDurationBase.ReadOnly = false;
Changing performance Counter Values
Monitoring performance means changing performance values after a certain amount of time. To do so, we can call one of the following methods on a System.Diagnostics.PerformanceCounter instance:
Increment() - increments the value of the counter by 1.
IncrementBy() - increments the value of the counter by a certain value.
Decrement() - decrements the value of the counter by 1.
DecrementBy() - decrements the value of the counter by a certain value.
RawValue - the property sets the value of the counter to a certain value.
_TotalOperations.Increment();
_OperationsPerSecond.Increment();
_AverageDuration.IncrementBy(ticks);
_AverageDurationBase.Increment();
Using AverageTimer32 And AverageBase
In the sample code above, you can see how we must increment the counters for calculating averages. While the counter of type PerformanceCounterType.AverageTimer32 is incremented by the time elapsed between two calls, the base counter - of type PerformanceCounterType.AverageBase - is incremented by 1 for each operation taken.
The .NET documentation for PerformanceCounterType.AverageTimer32 states the formula used to calculate the value of the counter as ((N2 - N1)/F)/(B2 - B1), where N1 and N2 are the timestamps of the start and end of the operation, B1 and B2 are the base values, and F is defined to be "the frequency of the ticks" which is divided out of the time span "so that the result can be displayed in seconds".
We should expect that we could use System.DateTime.Now.Ticks to measure N1 and N2, however, this is not the case, as these values are slightly inaccurate. In fact, we should use QueryPerformanceCounter() method via InterOp. You can choose yourself, if this is rather a bug in the framework than a lack of documentation.
[DllImport("Kernel32.dll")]
public static extern void QueryPerformanceCounter(ref long ticks);
PerformanceCounterSample test = new PerformanceCounterSample();
Random rand = new Random();
long startTime = 0;
long endTime = 0;
for (int i=0; i<1000; i++)
{
QueryPerformanceCounter(ref startTime);
System.Threading.Thread.Sleep(rand.Next(500));
QueryPerformanceCounter(ref endTime);
test.DoSomeProcessing(endTime - startTime);
}
Making Performance Visible
Most of you already know how to set up Performance Monitor to make performance counters visible. But for all those who don't know it yet, I will explain it in just a few words.
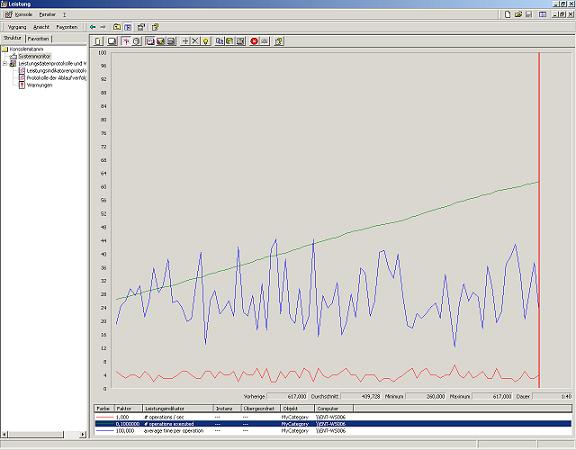
You find Performance Monitor under Administrative Tools in the Control panel. Double-click it and a window will show up with a Y-Axis ranging from 0 to 100 and a imaginary X-Axis, which depicts the time elapsed. You can add counters using the  button. In the opening window, the category Processor and in the category the counter Processor time should be pre-selected. You can change the categories with the dropdown listbox and counters with the listbox under that. On the right hand side, you see the instances available. If you leave the defaults and you have a multiprocessor machine, you can see as many instances as you have processors. One instance for each processor and an instance called _Total which means the total processor time used on all processors.
If your machine is running with a single-processor, switch the category to Process and see the listbox containing the counters changing. Again processor time should be pre-selected, but now you should see instances for each process currently running. Select the Idle process and click Add, and then close the window. Now you can see that the performance monitor starts recording performance. Move your mouse a little to take processor time from the idle process, and you should see that the curve drawn moves down when you move your mouse, and again goes up to 100 when you keep quiet (if you don't have other time consuming processes running).
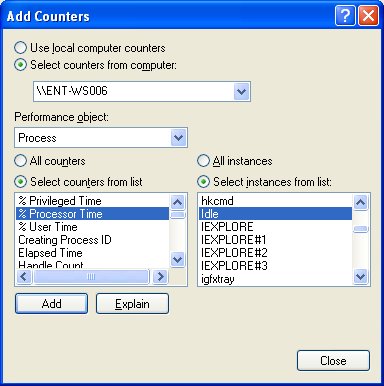
Figure 4
For some reasons, you might have to change the scale of the counter. To do so, right-click anywhere in performance monitor and select Properties and then Data. Select the counter of which you require to change the scale, and change the factor with the dropdown listbox, and click OK. You can also change the color and thickness of the curve drawn for that counter here.
Play with the performance monitor a little to understand how you can monitor performance using it.
Putting It All Together
The following sample sets up a new category "MyCategory" and adds some performance counters to it ("# operations executed", "# operations / sec", "average time per operation").
It simulates processing by calling the method PerformanceCounterSample.DoSomeProcessing() after some random time elapsed and updates the counters. To see the performance flow, open Performance Monitor and add the corresponding counters. You might have to change the scale of the "average" counter, because the result of the average is in seconds, but the delay between two operations always takes less than 500ms.
