Introduction
While developing WPF applications, design view plays an important role not only placing the controls but also we can see the run time view at design time. How does it look like? It becomes frustrating when we see some design time errors and we cannot put a break point in XAML file to diagnose the error, moreover due to this single error sometimes, whole designer fails rendering other controls. So this article enables us to debug the design view of XAML documents in WPF.
Background
It is a pre-requisite that one should be familiar with basic WPF and most importantly one should know how to set design time data context. You can refer to other articles on CodeProject to know how to set a design time data context like this one.
Problem
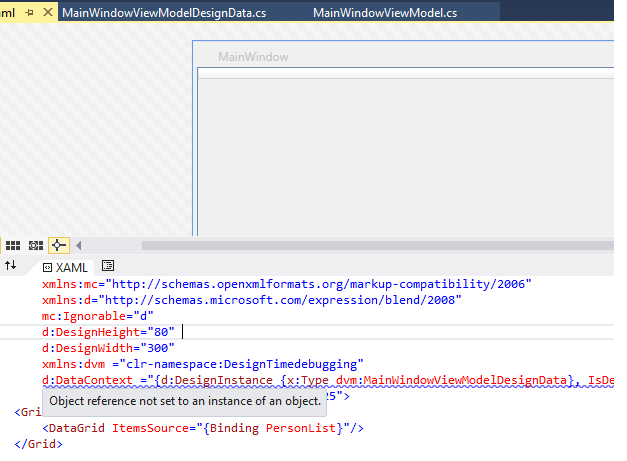
While designing WPF applications, we frequently see the following types of error in our design view (See pic). Since XAML code does not allow us to insert a break point and debug the stuff, I will share a small trick to trap this error. (References are already there on the internet, but still developers are not so habituated to using it. The reason is that most of them don't know it.)

Steps To Debug the Design Time Errors
- First of all, close all opened XAML documents in Visual Studio.
- Open the new instance of the same application in Visual Studio (say
app2).
- Again, close all opened XAML documents. (To be on the safe side, you may close all documents in
app2).
- Now open Task Manager just to verify whether XDesProc.exe must not be running. (Basically XDesProc.exe is responsible for debugging XAML files, so if any XAML documents are opened, then it launches automatically). So, if you find that XDesProc.exe is running (in Processes Tab), just kill it (right click on process and click on End Process Tree option).
- Now switch to
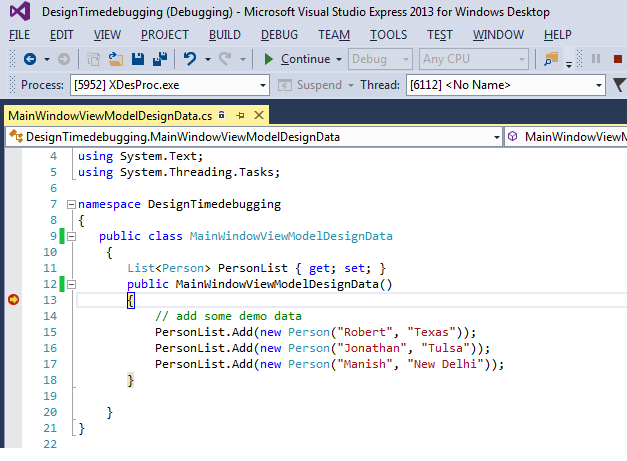
app1 (original instance of Visual Studio in which you want break point to be hit). Now, open the file containing the design data view model (MainWindowViewModelDesignData.cs) and place a break point in the first line of its constructor.
- Switch to
app2 again and open the View (i.e. MainWindow.xaml in which design time error is raising). It will launch the XDesProc.exe in Task Manager.
- Switch to
app1 again, and go to Debug -> Attach to Processes... context menu item in Menu bar of Visual Studio.
- Search the XDesProc.exe and click on attach button.
- Switch to
app2 and close and reopen the same XAML document (MainWindow.xaml). Once you do it, break point will get hit!

- Here, you will find that you have not instantiated the
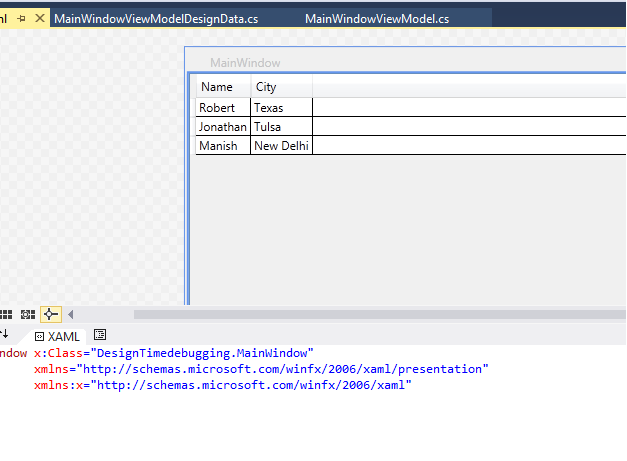
PersonList property which is causing NullReference Exception in WPF Designer. After fixing it, you will see that now the designer is showing the data as well.

Points of Interest
For Visual Studio 2010 users, you will find devenv.exe in place of XDesProc.exe. Also, you can tweak with the exception settings if your break point does not becomes active (i.e., Go to Debug -> Exceptions settings -> Common Language RunTime Exceptions).
