Introduction
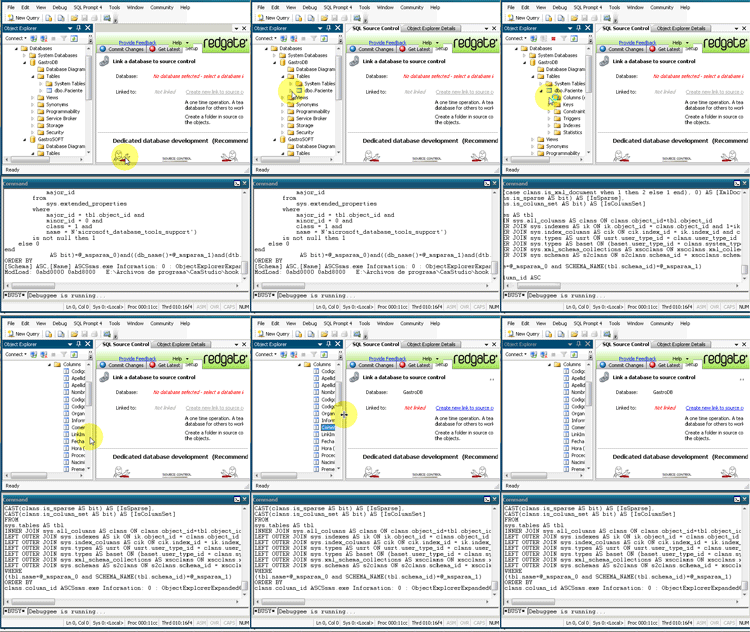
SQL Server Management Studio has been designed for very fast interaction for the Administrator and/or users with SQL Server objects. We can see the objects by just clicking on the appropriate item, for example, to get the views or the users.
The purpose of this article is to show how, with a quick knowledge of assembler language and pointers, we have the possibility to extract useful information without having the source code for any app. You can apply this article to show queries in runtime for any .NET system. Reverse Engineering for fun. It can also be applied for Worker Processes on IIS for live debugging without Visual Studio.
Let's start. You will need a basic knowledge of .NET Debugging on Runtime Debugging tools like Windbg. For heuristic knowledge of .NET environments, a natural way to execute commands is the SQLCommand object, but we need to confirm this by checking if the Management Studio process has instantiated this class. Let's start.
Steps
- Open SQL Server Management Studio.
- Login to SQL Server and execute some operations like view the objects or databases.
- Open the Windows debugger tool and attach the SQL Server Management Studio process:

- Once attached, we can find a command line inside the Windows debugger.
- There is a useful helper for debugging, and we can load this by using:
.loadby sos mscorwks
SOS WinDbg extensions allow to explore .NET objects at low level, based on the correct mscorwks.
- Execute:
!dumpheap -type SqlCommand -stat
Dump .NET Heap for SqlCommand type (-type), and obtain its statistics (-stat).

- Now we have where the .NET Method Table is located, for
SqlCommand; go forward exploring which methods it encapsulates. Use:
!dumpmt -md 6523db08
Explaining the command: dump method descriptions given a Method Table code.

- Good that we have the list of methods and their entry points. Many .NET SQL commands use
ExecuteReader for query execution. We can search on this: 
- Ok, we got it; we found the entry point for this function. Let's set a breakpoint there. Use:
Bp 651f9c24
and press F5 to continue Management Studio execution.
- Play with Management Studio while the debugger is still attached. By doing this, you will observe Management Studio freeze, what happened? The breakpoint has already been triggered.
- Now go WinDbg again:

- Yes, we can confirm that Windbg has stopped as expected.
- We can start exploring the Managed Stack objects. To do this, use:
!dso
Dump the stack objects:

- Great !!! Now we have a part of the SQL command and we can observe the
SqlCommand on top of our stack. Why not see the content? To do this, we can use:
!do 0c51f004
Explaining: the !do=dump object given an address, 0c51f004 in this case.

- Interesting information dumped there, the command text is there. But where is it located? The answer is in the offset. We need to get the pointer of the current SqlCommand+10, and display the string (
CommandText) contained there:
!do poi(0c51f004+10)
Explaining: !do=dump the object, given a pointer to the 0c51f004+10 position. Nice, we have what we expected.

- 0c51f004 is a fixed address, but what does this address contain on any of the records? Let's review; just execute:
r
to display the processor record.

- Good, we can try this then:
!do poi(ecx+10)

- But as you can observe, we have a lot of not so useful information. We just need to print the string query. We can do the following trick:
.printf "%mu",poi(ecx+10)+c

- You are probably asking: Why printf? Why %mu ? poi(ecx+10)+c?
printf prints a string ending in 0, %mu prints a Unicode string, poi(ecx+10) is clear, but why +c? Because the first char of a string class starts at the +c offset. You can see another article to clarify this: http://www.codeproject.com/KB/miscctrl/extractstringprocess.aspx - Do we need to do this for every single command executed? The answer is no. This is why WinDbg has conditional breakpoints. Remember that we broke on the
SqlReader command execution, and we can use:
bp eip ".printf \"\\n%mu\",poi(ecx+10)+c;gc"
Break in the current eip address (Current Execution Address), and once this stops, execute the command between double quotes (we explained this). Once this get this done, just press F5 and enjoy playing with Management Studio and looking at the SQL commands!!!
