Introduction
Gantt Chart is one of the possible ways of data visualization. Since these charts allow visualizing the workflow in the intuitive way they are widely used in project management software. In this article, I want to cover the process of creation of an online Gantt chart application. There are only two components I’ll use: MeteorJS and dhtmlxGantt. Let’s take a closer look at them.
dhtmlxGantt and MeteorJS Basic Features
dhtmlxGantt is an open source JavaScript Gantt chart. Besides the Gantt chart creation, it allows you to add some extra features to your project, e.g. exporting, important tasks highlighting, filtering, zooming, critical path, deadlines, etc. Here’s the basic chart demo for you to understand how it looks and behaves. Want more? Here’s a bunch of samples that covers most of its features.
MeteorJS is an open-source complete full-stack JavaScript framework written using Node.js. It was designed to simplify the web applications development process. Its main feature is the possibility to transfer data changes in real-time. And there’s no need to write extra synchronization code. You can visit this page to check the features list.
Creating the Gantt Chart
First of all, we need to install MeteorJS and create the simple Meteor application.
Installing MeteorJS and Creating Your First Application
The way of installation may vary from one OS to another. On OS X or Linux you should run in your terminal the following command:
curl https://install.meteor.com/ | sh
If you use Windows, you should get the installer. Visit this installation guide for the details.
After you install NodeJS, you can open your terminal and create the basic application. Let’s call our project my-chart:
meteor create my-chart
This code will create the folder with my-chart name. Within this folder, you can find a couple of files and a folder that your project consists of at this stage. Here’s how they look like on my Linux system:
.meteor
my-chart.css
my-chart.html
my-chart.js
You can already run this basic application to make sure that everything works fine. Just type the meteor command from your project’s directory:
Here’s the output you’ll get in case everything fine:
=> Started proxy.
=> Started MongoDB.
=> Started your app.
=> App running at: http:
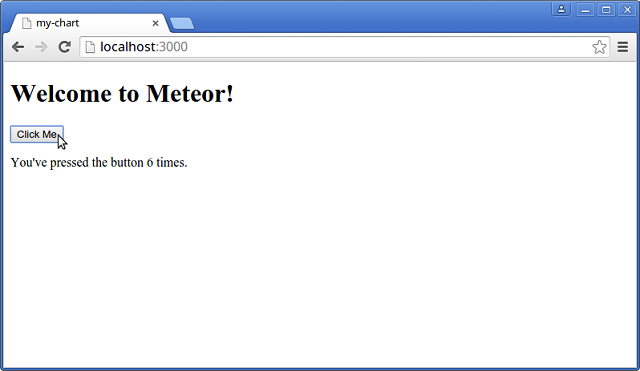
It’s a little web page with the button that counts the number of clicks. Well, it seems that everything works. Let’s proceed with dhtmlxGantt.
Adding dhtmlxGantt to Your Project
You can either download the package from the developer’s website or use the special Meteor package. Since there’s no reason for us to do some routine work such as downloading, unpacking and so on, let’s choose the second option:
meteor add dhtmlx:gantt
The next step is to get the data adapter that will enable real-time data update:
meteor add dhtmlx:gantt-data
Alright, all the required packages are downloaded, and we can continue creating the chart.
According to the documentation, the my-chart.html file defines view templates which mean that we can place our HTML code in it. Open the file and replace the code it contains with the following:
<body>
    <div id="gantt_here" style='width: 100%; height: 400px;'></div>
</body>
This code will create the DIV container. We’ll soon place the chart within it.
The my-chart.js file is a JavaScript file loaded on both client and server. It will contain the code that creates the data storage, initializes and configures the chart.
MeteorJS uses the MongoDB database. You should use so-called Collections to store the data. Collections can be accessed both from the server and the client. Moreover, they update themselves automatically which means that all changes will be rendered on the screen immediately.
We should create two Collections. The first one will contain the data that describes the existing tasks. The second one holds the information about the links between the tasks.
Open the my-chart.js file and change its content to this:
TasksCollection = new Mongo.Collection("tasks");
LinksCollection = new Mongo.Collection("links");
The next step is to initialize the chart and use the data adapter. We want to run our chart code on the client side. We’ll use if (Meteor.isClient) statement for that purpose. To run the code we need, we can use this code: Meteor.startup(func).
Assuming this info, we can add to our .js file something like that:
if (Meteor.isClient) {
Meteor.startup(function() {
});
}
There are few short steps that separate us from the goal. First of all, we should initialize the chart within the previously created DIV container:
gantt.init("gantt_here");
The last step is to initialize the data adapter:
gantt.meteor({tasks: TasksCollection, links: LinksCollection});
gantt.meteor(
{tasks: TasksCollection.find(), links: LinksCollection.find()},
{tasks: TasksCollection, links: LinksCollection}
After you put this code within the client side function, you can run the application. Just open your terminal and type:
meteor
After that you can check the results in your browser:
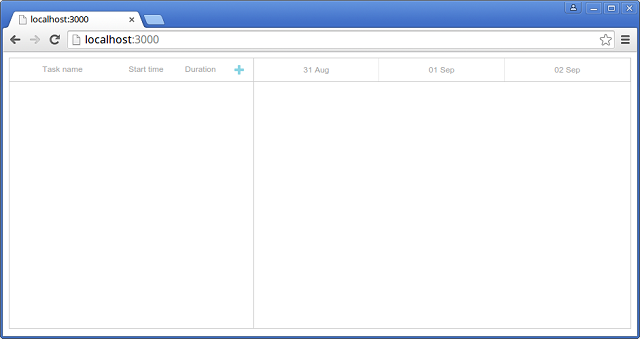
This chart doesn’t have any data to render. We should create the task to see how it works. Click this “+” button and the “New Task” window will appear on the screen:
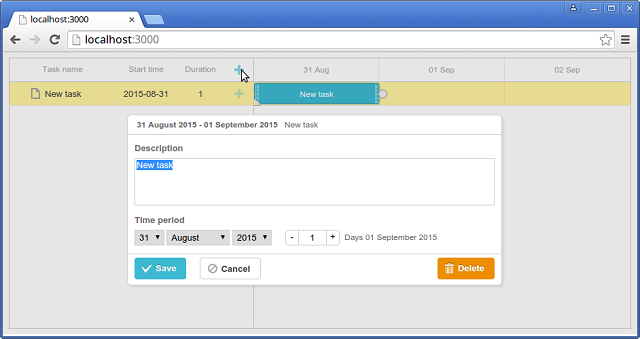
You can create as many tasks as you want, define the links between them, drag them through the calendar grid to change the start time and resize them to change the duration. The best part about it is that you can close the browser shut down the server, and after you run it again you’ll see that all your tasks are in the right places.
Real-time Changes
Let’s check how the MeteorJS application reacts to changes. We’ll start with the simple example. Remember how we defined the DIV container? Let me remind you:
<body>
    <div id="gantt_here" style='width: 100%; height: 400px;'></div>
</body>
Well, here’s the deal. You can change this code and after you save the changes there will be no need to refresh the page or do some other extra job. Application appearance will change automatically.
For example add this code to the style attribute:
border: 2px solid #222
Save it and after a couple of moments the application will refresh itself and change the style of the border:
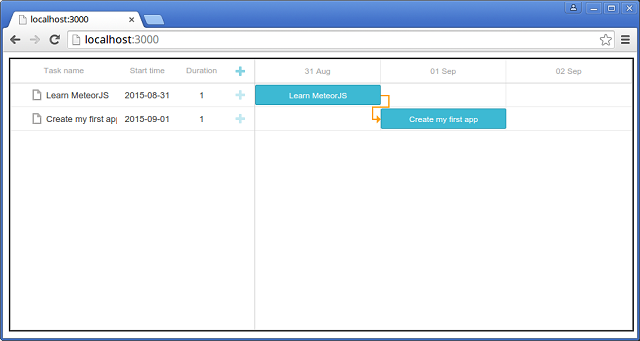
Now let’s check how the database works. Open new tab in your terminal, go to the project’s directory and run:
meteor mongo
This code will open a console into your app’s local development database. Now you can handle your database. Let’s do some search work:
db.tasks.find({text:"Create my first app"});
This code will find the second task from our database. Here’s the output that I got:
{ "_id" : "YFhwdZxWtWns2g6oq", "id" : "1441072445217",
"start_date" : ISODate("2015-08-31T21:00:00Z"),
"text" : "Create my first app", "duration" : 1,
"end_date" : ISODate("2015-09-01T21:00:00Z"), "parent" : 0 }
Here you can see the values of the task properties, e.g. its ID, start date, duration, etc.
Let’s now delete this task. There are several ways to do it. We’ll use the Object ID value as an example:
db.tasks.remove({_id:"YFhwdZxWtWns2g6oq"});
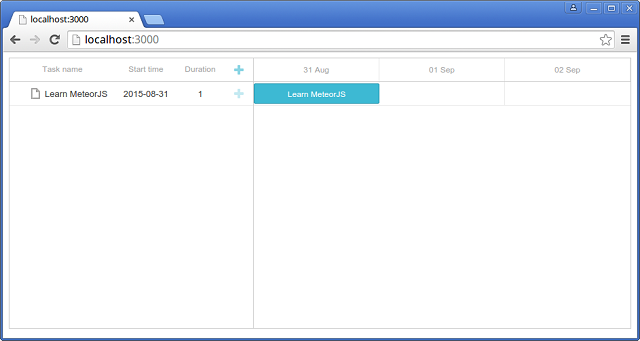
Run this command, then back to your browser and you’ll see that the task with the proper ID is deleted:
Conclusion
MeteorJS allows you create an online application in a few easy steps. You can compare the example from this article with this Getting Started Guide that requires much more time to build a basic chart. One of the best parts of MeteorJS is the possibility to see the changes in real-time. And there’s no need to do some hard work to make this feature work. Meteor was initially designed to work like that.
