Introduction
What is Linear Model?
Assume that you have an experiment to see how much human beings grow up (height) according to their age. You select couple of persons in different ages regardless of their sex, race and etc. Because it is important for you to know that what is behaviour of growing persons just based on their age. Therefore you will have a model which indicates you pattern of growing human height.
Because real world is not always deterministic and there are exceptions. In this example, there are other factors which can interfere on the result. For instances sex, race are factors which we do not want to bring them on our computation. Here "Height" is dependant variable because it is measured based on "Age" and "Age" is called independant variable or predictor or fixed effect. The formula for Linear Model Fixed Effect is:
Height ~ Age + error
error includes all other factors and parameters which might make influence on result but we do not aware them or we do not take them into account deliberately or undeliberately.
Age(cm) Height
55 5
15 120
20 170
25 175
Linear Model shows us the relatione and correlation between age and height while we have to consider to error because if we put race and sex params the result has been changed. There are samples who are shorter or taller because of gender or race.
Install R
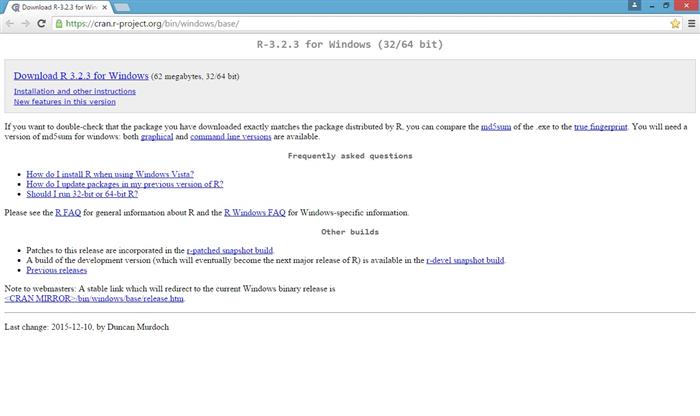
R is a suitable software for innterpretation statistical computing and it can depict appropriate graphics which have a huge impact on our understanding about our variables and therir relation. As first step go to https://cran.r-project.org/bin/windows/base/ and install proper version accoriding to your operating system.
If you have windows so select Download R 3.2.3 for windows


Now start R to enter commands and create statistical interpretation and graphics.

Using the code
Now on the command line:
Height = c(55, 120, 170, 175)
Age = c(5, 15, 20, 25)
mydf=data.frame(age, height) --> "data.frame" will assign and combine two variables to each other.
mymodel = lm(height~age, mydf) --> "lm" is linear model command
summary(mymodel) --> "summary()" produces valuable information about data.

Residual:
Residual is differentiation between real value of height and predicted line.
Command "Plot(age, height)" can illustrate scattered point as follow:

While Plot(mymodel) has more meaningful graph about our model.
Intercept:
Intercept is mean value of Y "height" when X or "Age" is 0 , if X can nnot be zero so intercept has nno meaning.
Multiple R Squared:
R Squared means how much variance we have while adjusted one tells how many fixed effects are involved.
P-Value:
P-Value indicates that if our fixed values has iinfluence on our model or not.
Hist(residuals(mymodel)) --> makes a histogram of model

qqnorm(residuals(mymodel)) --> is normal probability plot of residuals, it compares our data set with normal distribution.

History
First Version: 20th December 2015.
