
Overview
“Function Point Analysis” is probably as close to a pure engineering paradigm as one could get. It was designed to allow professional software developers to determine the size of a software development effort by attributing calculated metrics to each individual component that would make up the entire endeavor.
There are a number of variations of this process, including more recent developments, but this paper will explore the original paradigm so that developers can have an initial starting point for further research. The original methodology, though a bit complex, can provide just as accurate a forecasted set of metrics for any software development project as the more recent developments for this technique.
It should be noted that “Function Point analysis” is not very well suited for maintenance tasks since many such tasks would be considered quite compartmentalized and usually only involve only one or two individual developers. As such, these tasks often do not require the in-depth analysis for scheduling that major endeavors require.
However, for new endeavors or even complex modifications to existing systems, in-depth analysis of the effort requires some level of accurate forecasting for the time it would take to complete. This is what “Function Point Analysis” does, and it does it quite well. Despite the claims by many Agile promoters, software development can be measured effectively and subsequently provide accurate estimations of how much time it would take to complete a certain task within a development effort.
And despite the promotion of rapid delivery of finished products in today’s hyper-fast technical environments there is little to support such speed except for a lot of discussion for the best processes that will deliver such capabilities. Human beings can work only so fast and be effective.
On the surface these process look like they are bringing something new and efficient to the table but in reality they are merely diluted interpretations of well-designed, mature techniques that are comprised of many years of research. Today’s “Agile” and “DevOps” phenomena are more fad than concrete techniques that offer technical managers a way to show that they are offering their organizations some form of process for software delivery that promotes quick turn-around. It is not surprising then that recently it is beginning to come to light that “Agile” has not been able to handle complex endeavors on its own giving rise to new theories regarding “Multi-Team Agile” and “DevOps” for large complex systems.
In this regard, “Function Point Analysis” serves as a “one size fits all” paradigm that can be applied to any level of complexity if done carefully and correctly. And it will provide technical teams with the shortest, possible schedule humanly possible for any given project.
Software systems, unless they are thoroughly understood, can be like an iceberg. They are becoming increasingly difficult to understand as they become more granulated as a result of the introduction of and growing popularity of the MVC paradigm for web-based applications and the MVVM technique for desktop projects among others. Simplistic languages are scoffed in favor of obscure syntactical equivalents that make reading such code more difficult.
Software development professionals have come under the impression as result of good marketing by vendors and individual developers who appear to have developed new techniques, along with their cheerleaders in the development community that scaling down vital functionality to quality software development efforts is somehow required to fulfill the “ever changing requirements” of business organizations. Nothing could be further from the truth and little if any actual independent research has been done to show if such new techniques actually benefit developers or the organizations they serve. It is not likely however, since so many unproven technologies are being advanced into production environments casting aside more mature and stable technologies, both of which do exactly the same things, the older technologies actually doing a better job of it.
In either case, software systems are already difficult to understand in their complexity and recent technology introductions have only made this situation worse causing “Agile” to come under fire by some of its original promoters.
With such complexity, “Function Point Analysis” provides a structured technique for problem solving. It is a method to break systems into smaller components, so they can be better understood and analyzed. It is in effect an application of the scientific method to the forecasting of development timelines.
“Function Points” are a unit measure for software much like an hour is to measuring time, miles are to measuring distance or Celsius is to measuring temperature. Function Points are an ordinal measure much like other measures such as kilometers, Fahrenheit, hours, so on and so forth.
In the world of “Function Point Analysis”, systems are divided into five large classes and general system characteristics. The first three classes or components are “External Inputs”, “External Outputs” and “External Inquires”. Each of these components transact against files therefore they are called transactions. The next two, “Internal Logical Files” and “External Interface Files” are where data is stored that is combined to form logical information.
Brief History
“Function Point Analysis” was developed first by Allan J. Albrecht in the mid 1970s. It was an attempt to overcome difficulties associated with “lines of code (LOC)” as a measure of software size, and to assist in developing a mechanism to predict effort associated with software development. The method was first published in 1979, then again, later in 1983. In 1984 Albrecht refined the method and in 1986 the “International Function Point User Group (IFPUG)” was set up, which produces the standard manual on “Function Point Analysis”. However, this manual which can be purchased at http://www.ifpug.org/ costs around $87.00. Earlier, free versions are available from a variety of sites such as that can be found at http://ainfo.cnptia.embrapa.br/digital/bitstream/item/34989/1/0004-3-1-Part-0-2010-01-17.pdf, which provides the 4.3.1 publication, which came out in 2010. The later 4.4.1 publication may also be freely available but one will have to do so digging to find it.
As recently as 2013, the “Software Engineering Institute” of Carnegie Mellon University (http://resources.sei.cmu.edu/library/) published a paper (“Software Assurance Measurement—State of the Practice”) that describes in detail many of the techniques available for software effort measurement, which can be download from…
http://resources.sei.cmu.edu/asset_files/technicalnote/2013_004_001_72891.pdf
As the following excerpt from the paper just noted, “Function Point Analysis” is still considered the standard in software engineering for measuring software development efforts…
>>>
5.3 The Other Side of the Equation: Problems with Measures of Software Size
Counting of lines of code is perhaps the first way the software industry measured itself. The number of lines of code is a measure that can serve as a proxy for a number of important concerns, including program size and programming effort. When used in a standard fashion—such as thousand lines of code (KLOC)—it forms the basis for estimating resource needs. Size is an inherent characteristic of a piece of software just like weight is an inherent characteristic of a tangible material. Software size, as a standard measure of resource commitment, must be considered along with product and performance measurement.
SLOC has traditionally been a measure for characterizing productivity. The real advantage of lines of code is that the concept is easily understandable to conventional managers. However, a lines-of-code measurement is not as simple and accurate as it might seem. In order to accurately describe software in terms of lines of code, code must be measured in terms of its technical size and functional size. Technical size is the programming itself. Functional size includes all of the additional features such as database software, data entry software, and incident handling software. The most common technical sizing method is still probably number of lines of code per software object. However, function point analysis (FPA) has become the standard for software size estimation in the industry. FPA measures the size of the software deliverable from a user’s perspective. Function point sizing is based on user requirements and provides an accurate representation of both size for the developer/estimator and business functionality being delivered to the customer. FPA has a history of statistical accuracy and has been used extensively in application development management (ADM) or outsourcing engagements. In that respect, FPA serves as a global standard for delivering services and measuring performance.
FPA includes the identification and weighting of user recognizable inputs, outputs, and data stores. The size value is then available for use in conjunction with numerous measures to quantify and evaluate software delivery and performance. Typical management indexes that are based on function points include
- development cost per function point
- delivered defects per function point
- function points per staff month
The primary advantages of FPA are that it can be applied early in the software development life cycle, and it is not dependent on lines of code. In effect, FPA is technology agnostic and can be used for comparative analysis across organizations and industries. Since the inception of FPA, several variations have evolved, and the family of functional sizing techniques has broadened to include such sizing methods as Use Case Points, FP Lite, Early and Quick FPs, and Story Points, as well as variations developed by the Common Software Measurement International Consortium (COSMIC) and the Netherlands Software Metrics Association (NESMA).
<<<
Objectives of Function Point Analysis
Frequently the term “end user” or “user” is used without specifying what is meant. In this case, the user is a sophisticated user; someone that would understand the system from a functional perspective; more than likely someone that would provide requirements and\or does acceptance testing.
Since “Function Points Analysis” measures systems from a functional perspective they are independent of technology. Regardless of language, development method, or hardware platform used, the number of function points for a system will remain constant. The only variable is the amount of effort needed to deliver a given set of function points; therefore, “Function Point Analysis” can be used to determine whether a tool, an environment, or a language is more productive compared with others within an organization or among organizations. This is a critical point and one of the greatest values of “Function Point Analysis”.
“Function Point Analysis” can provide a mechanism to track and monitor scope creep. “Function Point Counts” at the end of requirements, analysis, design, code, testing and implementation can be compared and used as internal metrics for comparative studies against similarly completed projects within an organization. The “Function Point Count” at the end of requirements analysis and/or design can be compared to the “Function Points” actually delivered.
If it is shown that a project has grown, there has been scope creep. The amount of growth is an indication of how well requirements were gathered by and/or communicated to the project team. If the amount of growth of projects declines over time it is a natural assumption that communication with the user community has improved
Characteristic of Quality Function Point Analysis
“Function Point Analysis” should be performed by trained and experienced personnel. If “Function Point Analysis” is conducted by untrained personnel, it is reasonable to assume the analysis will done incorrectly. The personnel counting “Function Points” should utilize the most current version of the “Function Point Counting Practices Manual”.
Current application documentation should be utilized to complete a function point count. For example, screen formats, report layouts, listing of interfaces with other systems and between systems, logical and/or preliminary physical data models all will all assist in “Function Points Analysis”.
The task of counting “Function Points” should be included as part of the overall project plan. That is, counting “Function Points” should be scheduled and planned. The first “Function Point” count should be developed to provide sizing used for estimating.
The Five Major Components
Since it is common for computer systems to interact with other computer systems, a boundary must be drawn around each system to be measured prior to classifying components. This boundary must be drawn according to the user’s point of view. In short, the boundary indicates the border between the project or application being measured and the external applications or user domain that it will interface with. Once the border has been established, components can be classified, ranked and tallied.
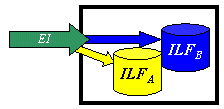
External Inputs (EI) – These are elementary processes in which data crosses the boundary from outside to inside. This data may come from a data input screen or another application. The data may be used to maintain one or more internal logical files. The data can be either control information or business information. If the data is control information it does not have to update an internal logical file. The graphic represents a simple EI that updates 2 ILF’s (FTR’s).
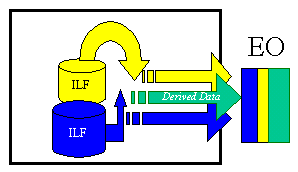
External Outputs (EO) – These are elementary processes in which derived data passes across the boundary from inside to outside. Additionally, an EO may update an ILF. The data creates reports or output files sent to other applications. These reports and files are created from one or more internal logical files and external interface file. The following graphic represents on EO with 2 FTR’s there is derived information (green) that has been derived from the ILF’s.
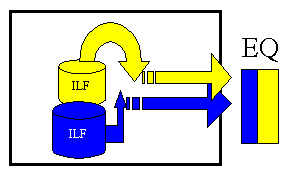
External Inquiries (EQ) – These are elementary processes with both input and output components that result in data retrieval from one or more internal logical files and external interface files. The input process does not update any Internal Logical Files, and the output side does not contain derived data. The graphic below represents an EQ with two ILF’s and no derived data.
Internal Logical Files (ILF’s) – A user identifiable group of logically related data that resides entirely within the applications boundary and is maintained through external inputs.
External Interface Files (EIF’s) – A user identifiable group of logically related data that is used for reference purposes only. The data resides entirely outside the application and is maintained by another application. The external interface file is an internal logical file for another application.
All components are rated as Low, Average, or High
After the components have been classified as one of the five major components (EI’s, EO’s, EQ’s, ILF’s or EIF’s), a ranking of low, average or high is assigned. For transactions (EI’s, EO’s, EQ’s) the ranking is based upon the number of files updated or referenced (FTR’s) and the number of data element types (DET’s). For both ILF’s and EIF’s files, the ranking is based upon record element types (RET’s) and data element types (DET’s). A record element type is a user recognizable subgroup of data elements within an ILF or EIF. A data element type is a unique user recognizable, non-recursive, field.
Each of the following tables assists in the ranking process (the numerical rating is in parentheses). For example, an EI that references or updates 2 File Types Referenced (FTR’s) and has 7 data elements would be assigned a ranking of average and associated rating of 4. Where FTR’s are the combined number of Internal Logical Files (ILF’s) referenced or updated and External Interface Files referenced.
EI Table
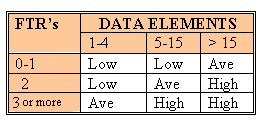
Shared EO and EQ Table
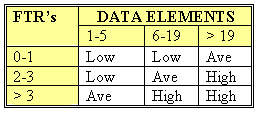
Values for Transactions
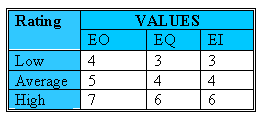
Like all components, EQ’s are rated and scored. Basically, an EQ is rated (Low, Average or High) like an EO, but assigned a value like an EI. The rating is based upon the total number of unique (combined unique input and output processes) data elements (DET’s) and the file types referenced (FTR’s) (combined unique input and output processes). If the same FTR is used on both input and output processes, then it is counted only one time. If the same DET is used on both input and output processes, then it is only counted one time.
For both ILF’s and EIF’s the number of record element types and the number of data elements types are used to determine a ranking of low, average or high. A “Record Element Type (RET)” is a user recognizable subgroup of data elements within an ILF or EIF. A “Data Element Type (DET)” is a unique user recognizable, non-recursive field on an ILF or EIF.
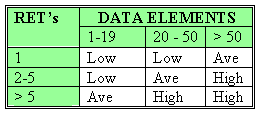
Record Element Type Ratings Applied to ILFs/EIFs

The counts for each level of complexity for each type of component can be entered into a table such as the following one. Each count is multiplied by the numerical rating shown to determine the rated value. The rated values on each row are summed across the table, giving a total value for each type of component. These totals are then summed across the table, giving a total value for each type of component. These totals are then summoned down to arrive at the “Total Number of Unadjusted Function Points”.
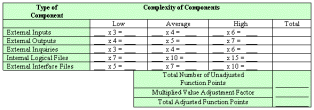
Click to Enlarge
The value adjustment factor (VAF) is based on 14 general system characteristics (GSC’s) that rate the general functionality of the application being counted. Each characteristic has associated descriptions that help determine the degrees of influence of the characteristics. The degrees of influence range on a scale of zero to five, from no influence to strong influence. The IFPUG Counting Practices Manual provides detailed evaluation criteria for each of the GSC’S, the table below is intended to provide an overview of each GSC.
| General System Characteristic | Brief Description |
| 1. | Data communications | How many communication facilities are there to aid in the transfer or exchange of information with the application or system? |
| 2. | Distributed data processing | How are distributed data and processing functions handled? |
| 3. | Performance | Was response time or throughput required by the user? |
| 4. | Heavily used configuration | How heavily used is the current hardware platform where the application will be executed? |
| 5. | Transaction rate | How frequently are transactions executed daily, weekly, monthly, etc.? |
| 6. | On-Line data entry | What percentage of the information is entered On-Line? |
| 7. | End-user efficiency | Was the application designed for end-user efficiency? |
| 8. | On-Line update | How many ILF’s are updated by On-Line transaction? |
| 9. | Complex processing | Does the application have extensive logical or mathematical processing? |
| 10. | Reusability | Was the application developed to meet one or many user’s needs? |
| 11. | Installation ease | How difficult is conversion and installation? |
| 12. | Operational ease | How effective and/or automated are start-up, back-up, and recovery procedures? |
| 13. | Multiple sites | Was the application specifically designed, developed, and supported to be installed at multiple sites for multiple organizations? |
| 14. | Facilitate change | Was the application specifically designed, developed, and supported to facilitate change? |
Once all the 14 GSC’s have been answered, they should be tabulated using the IFPUG “Value Adjustment Equation (VAF)” —
14 where: Ci = degree of influence for each General System Characteristic
VAF = 0.65 + [ ( å Ci) / 100] .i = is from 1 to 14 representing each GSC.
i =1 å = is summation of all 14 GSC’s.
The final “Function Point Count” is obtained by multiplying the VAF times the Unadjusted Function Point (UAF).
FP = UAF * VAF
Summary of benefits of Function Point Analysis
“Function Points” can be used to size software applications accurately. Sizing is an important component in determining productivity (outputs/inputs).
They can be counted by different people, at different times, to obtain the same measure within a reasonable margin of error.
“Function Points” are easily understood by the non-technical user. This helps communicate sizing information to a user or customer.
“Function Points” can be used to determine whether a tool, a language, an environment, is more productive when compared with others.
Conclusions
Accurately predicting the size of software has plagued the software industry since the inception of commercial software development in the 1960s. “Agile” has done little to mitigate this issue. “Function Points” are becoming widely accepted among true software engineers as the standard metric for measuring software size. Now that “Function Points” have made adequate sizing possible, it can now be anticipated that the overall rate of progress in software productivity and software quality will improve. Understanding software size is the key to understanding both productivity and quality. Without a reliable sizing metric relative changes in productivity (“Function Points” per Work Month) or relative changes in quality (Defects per “Function Point”) cannot be calculated. If relative changes in productivity and quality can be calculated and plotted over time, then focus can be put upon an organizations strengths and weaknesses. Most important, any attempt to correct weaknesses can be measured for effectiveness.
Function Points, Metrics & Project Schedule Estimation
“Function Point Analysis” in of itself cannot be the sole technique used to refine estimates for any software project. It is the merely the beginning point of any project that is to be realistically designed against quantifiable time-lines. For an organization that is using this or any such technique for the first time, the results are going to appear rather exaggerated when initial times are calculated. On the one hand this should be rather surprising since so many managers are used to dealing with highly unreasonable time tables. On the other hand, “Function Point Analysis”, when initially introduced, can only be based upon standard-means that have been derived from projects that have nothing to do with the organization. As a result, some exaggeration should be expected.
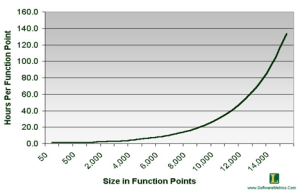
However, first and foremost, “Function Point Analysis” does not provide any concept of time. It instead provides an equivalent unit of time that still must be measured separately. There are two ways to do this; one by using an “Function Point Analysis” tool that provides intrinsic time-means measurements such as Construx’s estimate tool, “Construx Estimate” (http://www.construx.com/Resources/Construx_Estimate/), or second by applying the resultant “Function Point Analysis” number for a module against an effort-in-hours means chart such as the one that below:
Click to Enlarge
Once again, whichever of the two measurement techniques used for the conversion of function points into hours is applied; the initial estimates will only be numerically calculated averages, which is the best that can be expected of any estimation technique; especially when it is being used by a software team for the first time.
To refine such measurements and make them more reflective of the actual organization that is using them, project managers must, as any individual project progresses, begin to track module development milestones in order to calculate variances between estimates and actual times. As these metrics are counted and added to the project, over time they can then be used to average out the original estimates to more accurate predictions. Nonetheless, not until there is enough accrual of information and the project has developed an obvious rhythm of development can such estimate refinements be made.
Thus for example, once a module of “hard” complexity is finished a metric of time can be recorded to provide better estimates of similar modules. As each module of the same rating is completed, more information can be added to the project metrics to refine further the remaining efforts required for similarly rated modules that remain to be completed. As each new and refined estimate is generated it should become clearer as to what definitive date the project can be expected to be completed by. This result should show itself in the last part of the last phase of any project that has been managed properly. Until that point, managers must be aware that the best they can provide their users with are simply ever increasingly refined estimates which should most often point towards an ever increasingly specific period of time that project completion can be expected in.
Metrics for a single project are irrelevant though to the next project unless they are recorded accurately and understood within the circumstances under which they arose. Further, one project’s metrics cannot be simply used as a basis for measurement against a new project since the new project will require in most cases completely new designs and components. As a result, each new project should be calculated as the original one was starting from the beginning with completely pure “Function Point Counts”.
Once completed than the existing metrics can be averaged in to produce a new averaged metric which should be somewhat more accurate than that of the original project that first used “Function Point Analysis” as its estimating methodology.
Again we must regress here, as no matter how much data is acquired during project development in one group, it simply cannot be applied to another group or a different set of projects since the group’s metrics are a reflection of the abilities and constraints of the specific group.
To generate metrics that are more reflective of the organization as a whole then, such estimation techniques as “Function Point Analysis” must be used throughout the organization in the same manner with the same types of metrics being recorded for each project completed. The result is then an ability to generate more accurate estimates for projects within groups, across groups, sections, and eventually divisions.
In terms of metrics recording and analysis, “Function Point Analysis” provides only one of the components that provide software managers the ability to understand approximately how long any individual project will take. Beyond this there are several other areas that must be included in the time averages. Most importantly, must be the risk assessments that could hamper or delay project completion. Again, initial risk assessment has already been discussed but just importantly, accurate actual times must be recorded against those assessments if and when they occur.
Defect correction times must be recorded judiciously since the correction of such development anomalies must be provided for since every software project experiences them. Thus, if on the development of a module rated as complex, 15 defects are found during the first phase of testing, that number plus the time to correct them must be included in the overall analysis for estimate refinement. To make such analysis even more specific, correction times can be applied for each defect experienced which is actually the better way to promote recording. Once accomplished, a new estimate on a similar module in the same project can be again generated with the same expected defects incurring extra time for correction. It may be found that the 15 defects may in of itself be an anomaly where new metrics find that similar modules experience on average of 9 defects. The result then is knowledge that 15 defects may occur under specific circumstances and not all.
A Final Word
The complexity of “Function Point Analysis” is most often the primary factor that many technical managers use to ignore its potential while labeling it as a time waster that could not be implemented in their already chaotic environments. However, this is one of the primary foundations in actual software engineering for developing accurate and sustainable project timelines. There are other such measurements that are used that provide an even higher degree of complexity such as “Cost Benefit Analysis” paradigms that are used in such industries as aerospace. However, for software development, “Function Point Analysis” is the standard.
“Agile” attempts to use a variation on this technique by using what are called “Story Points”. How successful this has been is really unknown as there is little research that documents the success or failures of such a methodology. Nonetheless, as “Agile” is attempted to be applied to increasingly complex endeavors it is being found that the results are not what were expected. This is a result of the fact that most “Agile” promoters never took the time to really understand the foundations of software engineering and instead attempted to dilute it’s most robust features. Now new theories of using “Agile” in such endeavors are surfacing, which mostly appear to simply patch up a rather weak technique.
The use of “Function Point Analysis”, no matter the variation used, is one way to return developers to the basics of actual software development with corresponding engineering principals. Today’s development environments appear to be nothing but chaos, a derivative of the “sound bite” age. Maybe it is time to return to something old instead of trying something new…


