Yesterday at work, I came across the situation where I had inserted a breakpoint to debug some code inside my global.asax file in a web application, but the VS debugger never reaches it.
The first indication of trouble came when some data values loaded during application start never changed, even after I manually changed the database records. After a clean/build in VS, the values changed to what I expected, and debugging the global.asax file became possible. But the next debug run shows the values never change, and the code in global.asax is never reached. The initial thought that came to mind was that global.asax, where the application start events are fired, was acting very funny.
Reading up on this issue on the net brought up the overlooked fact that Cassini, the lightweight web server distributed with ASP.NET, does not close down after it has initially started, in order to increase performance the next time the application is run. This means that the application start events do not fire until the next time the web server process is restarted.
In essence, the problem I was facing was that each time I try to debug my global.asax file, if the application start events have already been fired and loaded, the code in the global.asax is skipped. Why it works when I do a clean/build is that Cassini has to restart after each build. The direct workaround for this is to go to the system tray, right-click on the Cassini icon and select stop. Now the debugger can reach breakpoints inside global.asax next time the application is run.
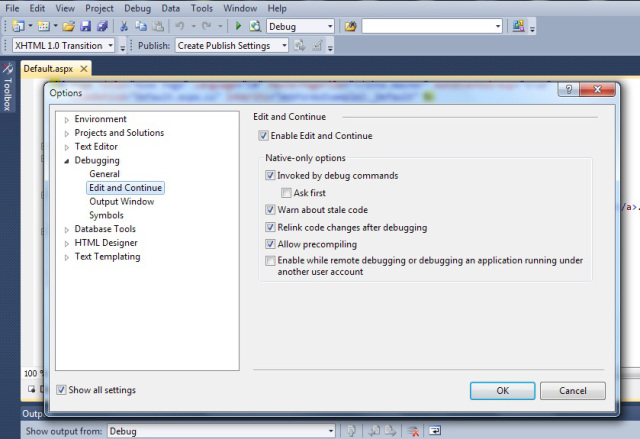
Rather than manually killing the process each time you stop debugging, you can use the edit and continue option in VS. Enabling edit and continue does not kill the Cassini process, but restarts it each time you debug the application. The option can be enabled in VS 2010 by selecting ‘debug’ in menu bar, and then option and settings:

If you are using IIS (as I was) to debug the web application, killing the Cassini process will not help. In this case, you have to start the IIS manager, and check which application pool your web application has been assigned to. Once you know the application pool, right clicking it and selecting advanced settings brings up the window shown below:

In this case, the idle time-out sets the time limit for the worker process to shut down. Changing the time to zero would disable the setting, and each time requests come in, the web application would load its application settings anew. If you do not want to change the setting, the alternative would be to restart the application pool by right clicking it, selecting stop, and again selecting start. But you would have to do this after each debug run, so disabling it by entering zero for the idle time-out would be the better option.
This in essence, are the activities you have to go through in order to debug global.asax files. I welcome any suggestions and ideas on the readers’ part.
CodeProject


