Introduction
This article is similar to http://www.codeproject.com/Articles/189711/Write-your-own-Debugger-to-handle-Breakpoints . We discuss Windows equivalent APIs of Linux: ptrace and in the process, write our own debugger (tracer) to debug a sample debuggee (tracee). I nearly died of a heart attack while using gdb, I hope to introduce to the readers the insides of a debugger with the hope that they might write a command line debugger that would be easy to use.
Background
The reader is required to have basic knowledge of Linux: especially signals and their handling. Debuggers rely on signals to get notifications from the debuggees (e.g.: SIGTRAP). The debuggers are always waiting for some signal from the tracee via the wait function.
The attached code is tested on Ubuntu 14.04, 64bit(Linux 3.16.0-55-generic)
Break Points
Breakpoint allows users to place a break in the flow of a program being debugged. The user may do this to evaluate certain conditions at that point in execution.
The debugger adds an instruction: int 3 (opcode : 0xcc) at the particular address (where break point is desired) in the process space of the executable being debugged. After this instruction is encountered:
-
The EIP is moved to the interrupt service routine (in this case int 3).
-
The service routine will save the CPU registers (all Interrupt service routines must do this), signal the attached debugger: the process that called :ptrace(PTRACE_ATTACH,pid....).
Using the Code
The attached code must be referred to at all times while reading this article.
The break point (opcode: 0xcc) is introduced in the debuggee (via code):
static unsigned char c[]={0xcc,0xc3,0x12,0x34,0x45};
static void (*pfunc)()=(void (*)())c;
static int i=mprotect((unsigned long int)c&0xfffffffffffff000,sizeof(c),
PROT_EXEC | PROT_READ | PROT_WRITE);
pfunc();
We make use of mprotect (equivalent of virtualprotect in Windows) to provide execute access to this memory.
All commercial debuggers will inject the break point (without code) by using the <span style="font-family: "Segoe UI",sans-serif;">ptrace(PTRACE_POKEDATA,...)</span>, the equivalent of <span style="font-family: "Segoe UI",sans-serif;">WriteProcessMemory</span> in Windows, they would obviously save the instruction before changing it and restoring it for correct execution.
Unlike Windows (which uses .pdb file), g++ compiler ships the debug symbols as part of the executable. addr2line tool can be used to pull out line and function detail via providing an address of that function (unless the executable has been stripped). The function addresses in Linux are absolute (they are not subjected to ASLR unlike the shared objects they load: https://en.wikipedia.org/wiki/Address_space_layout_randomization), therefore addr2line does not require processID through which executable base needs to be queried.
int PrintFileAndLine
(const char *debugSymbol,unw_word_t addr) {
char buffer[STR_MAX]={};
sprintf (buffer, "/usr/bin/addr2line
-C -e %s -f -i %lx", debugSymbol,addr); FILE* f = popen (buffer, "r");
fgets (buffer, sizeof(buffer), f);printf("function:%s",buffer);
fgets (buffer, sizeof(buffer), f);printf("file/line:%s******\n",buffer);
pclose(f);
}
The above code fragment shows us how to extract line and function name via function address of a running executable.
Getting the Call Stack
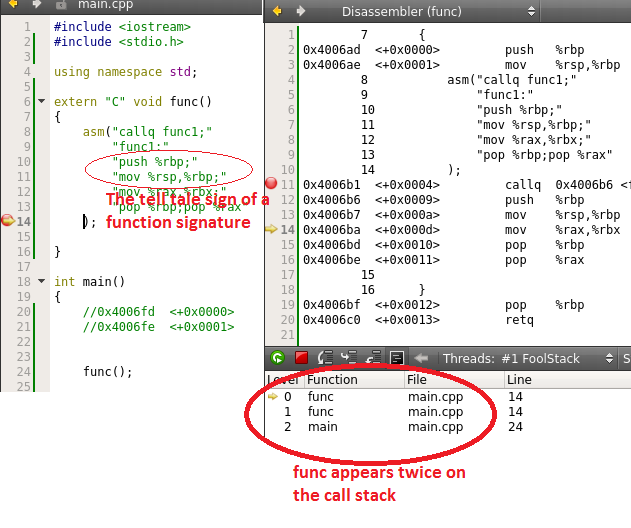
For Linux, no function equivalent to Windows <span style="font-family: "Segoe UI",sans-serif;">StackWalk64</span> exists though we have 3rd party stack unwind libraries (which we will use). When a stack walk is required, the debugger has to walk the stack (that belongs to the threadID from which <span style="font-family: "Segoe UI",sans-serif;">wait</span> returned) one byte at a time. Since Stack maintains only the returned address of the function, it has to check the preceding bytes to ensure that a call is made. Additional steps are taken to ensure that the function being called is indeed a function and not a label, this is done by looking at the telltale signs of a frame pointer being pushed onto a stack.

The below function makes use of a library to unwind the stack (apt-get install libunwind-setjmp0-dev), you might want to read: http://www.nongnu.org/libunwind/docs.html
void Getbacktrace(int thetid) {
unw_cursor_t cursor;
unw_word_t ip;
unw_addr_space_t as;
struct UPT_info *ui=NULL;
as = unw_create_addr_space(&_UPT_accessors,0);
ui = _UPT_create(thetid);
int rc = unw_init_remote(&cursor, as, ui);
while (unw_step(&cursor) > 0) { unw_word_t offset, pc;
unw_get_reg(&cursor, UNW_REG_IP, &pc);
char buffer[STR_MAX]={};
if (0==unw_get_proc_name(&cursor, buffer,
sizeof(buffer), &offset)) printf("%s\n", buffer);
PrintFileAndLine(DEBUGGEE,pc); }
_UPT_destroy(ui);unw_destroy_addr_space(as);
}
As mentioned earlier, the debugger will use wait, spin in the while loop (the code is self-explanatory) and will break out when the debuggee exits (an exercise for the readers since exit part is missing):
ptrace(PTRACE_ATTACH,pid,NULL);printf("error %u\n",errno);
while(1)
{
pid_t tid=wait(&status);
if(WIFSTOPPED(status))
{
.....
ptrace(PTRACE_GETSIGINFO,pid,NULL,&siginfo);
ptrace(PTRACE_CONT, pid, NULL, siginfo.si_signo);
}
}
Like GDB, you may want to swallow the SIGTRAP (=5), i.e., not propagate this signal back to the debuggee to be handled by its handler.
Points of Interest
Apart from writing a simple debugger, we can write advance profiling tools with this new found knowledge. ptrace is the key for implementing the debugger but can also be used to tamper, hook function calls in remote processes (with the help of mprotect, may be more of this later).
