One of the most annoying issues you may face while using JavaScript in an ASP.NET application is referencing a server control in a page that inherits from a Master page. As an example, say we have an asp textbox server control and we want to get its text, if you’ve tried to do this using the document.getElementById(‘controlId’) function, you’d get the error message "object expected" or "object is null;" so why do we get those errors while we are sure that the control’s ID and the JavaScript syntax are correct?! Well, the server controls’ IDs are changed in runtime, and they are concatenated with a prefix which is their content placeholder, which in our case it would be the content of the master page and you can be sure from this if you run any page and view its source HTML using Internet Explorer, try to search for any server control’s ID, you will find that it’s completely different from the one in the aspx file, so you have two choices in order to reference these controls correctly:
document.getElementById('id');
But this way is very poor and not flexible at all.
var txtBox = document.getElementById('<%=txtName.ClientID%>');
The symbols: <%=%> means that you can write any C# code inside them, so this way is very easy and flexible for anybody.
- First: you can view the HTML source code of each page and find the new generated IDs for your controls and place them in the JavaScript function:
- The second one: is using the encoding techniques to get the new generated ID programmatically; any ASP server control contains a property called
ClientID which provides us with the new generated ID for the control at run time, but we want to get this ID in the JavaScript code; so all we’ve to do is doing that:
You want to debug your JavaScript code and don’t know how?!! Here you have the solution: All you have to do is place all your JavaScript code in a separate .js file, so you’ll be able to insert breakpoints inside the JavaScript code, and then enable JavaScript debugging from your Internet Explorer. Here are the steps:
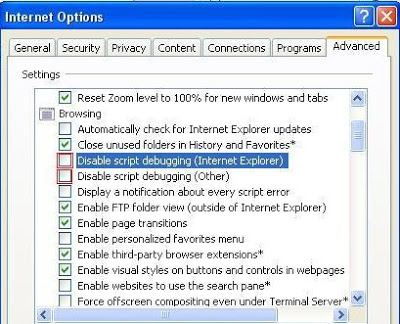
- From Tools menu, choose Internet Options, then Advanced Tab.
- Then under Browsing, uncheck the disable script debugging (Internet Explorer) & (Other).
- That’s all, insert your breakpoints into your JavaScript file, press F5 to Debug and enjoy.