This is a simple tutorial illustrating steps required for running R script from PHP and passing arguments from web interface to be consumed by R and output the results to different files residing on Ubuntu Server with corresponding markup on PHP web page. An example of discrete event simulation is used.

Introduction
After the release of our latest article "Discrete Event Simulation using R: Hospital Capacity Planning", we got constructive feedback from our colleagues. In conclusion, there was a compelling request to create a simple user-friendly interface for non-programmers. Instead of having to modify the parameters of the simulation from inside R-studio, why not use a simple form to feed the needed parameters and avoid the "side effects" of accidentally modifying the core script during the process of setting the simulation parameters through manipulation of the original code.
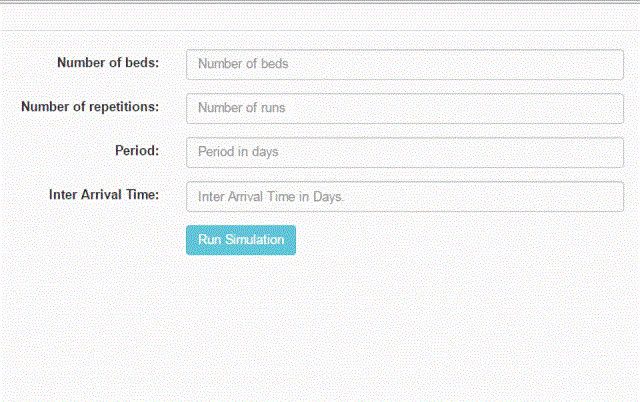
To run the simulation mentioned in the given article, we will need a form that will take 4 numeric parameters and submit it to the PHP page that will pass the arguments and execute R script using shell_exec(). The output of R will be stored in a folder. A PHP script will iterate through all files in this folder and create links to it and will create image source HTML tags to the output graph and display it, along with links to output files, in the output page.

Using the Code
The HTML Form
As mentioned above, we need to pass 4 arguments to the R script. We will use an HTML form to do the job. The user will enter the 4 values in the corresponding input fields and submit the form. The fom action will call runr.php with GET method.

<!--
<link href="https://maxcdn.bootstrapcdn.com/bootstrap/3.3.7/css/bootstrap.min.css"
rel="stylesheet"
integrity="sha384-BVYiiSIFeK1dGmJRAkycuHAHRg32OmUcww7on3RYdg4Va+PmSTsz/K68vbdEjh4u"
crossorigin="anonymous">
<script src="https://maxcdn.bootstrapcdn.com/bootstrap/3.3.7/js/bootstrap.min.js"
integrity="sha384-Tc5IQib027qvyjSMfHjOMaLkfuWVxZxUPnCJA7l2mCWNIpG9mGCD8wGNIcPD7Txa"
crossorigin="anonymous"></script>
<form class="form-horizontal" action="runr.php" method="get">
<fieldset>
<!--
<legend>Insert Simulation Parameters</legend>
<!--
<div class="form-group">
<label class="col-md-4 control-label" for="nbeds">Number of beds:</label>
<div class="col-md-4">
<input id="nbeds" name="nbeds" type="text"
placeholder="Number of beds" class="form-control input-md" required="">
</div>
</div>
<!--
<div class="form-group">
<label class="col-md-4 control-label"
for="myrep">Number of repetitions:</label>
<div class="col-md-4">
<input id="myrep" name="myrep" type="text"
placeholder="Number of runs" class="form-control input-md" required="">
</div>
</div>
<!--
<div class="form-group">
<label class="col-md-4 control-label" for="period">Period:</label>
<div class="col-md-4">
<input id="period" name="period" type="text"
placeholder="Period in days" class="form-control input-md" required="">
</div>
</div>
<!--
<div class="form-group">
<label class="col-md-4 control-label" for="myIAT">Inter Arrival Time:</label>
<div class="col-md-4">
<input id="myIAT" name="myIAT" type="text"
placeholder="Inter Arrival Time in Days."
class="form-control input-md" required="">
</div>
</div>
<!--
<div class="form-group">
<label class="col-md-4 control-label" for="submit"></label>
<div class="col-md-4">
<input type="submit" class="btn btn-info" value="Run Simulation">
</div>
</div>
</fieldset>
</form>
Execute R Script in runr.php
Once your form is submitted, you will be redirected to the runr.php page, which will do four functions:
[a] It will empty the output folder from the results of the previous simulation.
$files = glob('output/*');
foreach($files as $file){
if(is_file($file))
unlink($file);
}
[b] It will get the values submitted by the HTML form and store it into variables to be passed as arguments required by R script
$nbeds = $_GET['nbeds'];
$myrep = $_GET['myrep'];
$period = $_GET['period'];
$myIAT = $_GET['myIAT'];
[c] Execute R Script and pass arguments in the shell command:
$output=shell_exec("Rscript /var/www/html/mycmd/myscript.R $nbeds $myrep $period $myIAT");
echo $output;
[d] Display output of the R script as image and as links to files in output folder:
echo "<img src='output/output.png'>";

$files = scandir('./output/');

sort($files);

foreach($files as $file){
   echo'<a href="output/'.$file.'">'.$file.'</a>';
echo '<br>';
}

myscript.R
The above mentioned article contains the R script used to run the simulation in R studio. However, we need to fine tune the code if we are going to pass parameters and execute R script on Ubuntu server.
First, change the working directory:
setwd('/var/www/html/mycmd/output/')
Use commandArgs() function to scan arguments supplied when R script is called. The next step is to store arguments in variables.
args <- commandArgs(TRUE)

## Input Simulation parameters

nbeds<-as.integer(args[1])   ## number of beds
myrep<-as.integer(args[2])   ## number of repetitions
period<-as.integer(args[3])  ## run for two years
myIAT<-as.numeric(args[4])   ## Inter Arrival Time (in Days)
To export the chart into the desired folder that will be scanned by php to display on the web page, we will need to modify the R script as follows:
MyDataPlot<-grid.arrange(p1, p2, p3,p4, ncol=2)

png(filename="/var/www/html/mycmd/output/output.png", width = 800, height = 600)
plot(MyDataPlot)
dev.off()
The following command is added to export the console results as text file into the output folder to be later displayed as link on the web page:
sink('analysis-output.txt', append=FALSE, type = c("output", "message"))
Points of Interest
Installation of R on Ubuntu:
sudo apt-get update
sudo apt-get -y install r-base
Installation of simmer package:
> install.packages("simmer")
This command will install the dependencies as well. You will need to select the convenient mirror to download from. Furthermore, you will need to install more packages as it is needed in the R script to output the simulation charts.
> install.packages("ggplot2")
> install.packages("gridExtra")
> install.packages("dplyr")
> install.packages("tidyr")
These settings need a lot of optimization for best performance, we are illustrating a simple methodology to call R Script using a practical example. Beware of the "Resource Monster" especially if you are running the simulation with myrep >1000 .

References
History
- 25th August, 2016: Initial version
- 3rd December, 2021: Article updated
