Get access to the new Intel® IoT Developer Kit, a complete hardware and software solution that allows developers to create exciting new solutions with the Intel® Galileo and Intel® Edison boards. Visit the Intel® Developer Zone for IoT.
This project describes how to recognize certain types of human physical activities using acceleration data generated from the ADXL345 accelerometer connected to the Intel® Edison board.
Human activity recognition has a wide range of applications especially in wearables. The data collected can be used monitoring patient activity, exercise patterns in athletes, fitness tracking and so on.
We will be using support vector machine learning algorithm to achieve this. The project is implemented using the LIBSVM library and done separately in both Python and node.js.
The set of activities to be recognized are running, walking, going up/down a flight of stairs and resting. We collect the accelerometer data over a set of intervals, extract the features which in this case are the acceleration values along the x,y and z axes. We then use this data for building a training model that will do the activity classification.
The project code can be downloaded from here: Download
Hardware Implementation.
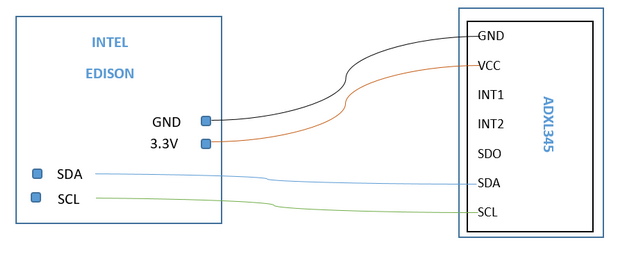
The diagram below shows the pin connection for the ADXL345 to the Intel® Edison board.

Part 1. Python Implementation.
Setting up LIBSVM
Download the LIBSVM library and transfer the LibSVM zipped folder to the Intel® Edison board root directory using WINSCP. Then extract it by running:
tar –xzf libsvm-3.21.tar.gz
Run make in libsvm-3.21 directory
Run make in libsvm-3.21/python directory
Create the predict-activity.py python script in the libsvm-3.21/python directory
Reading data from the ADXL345 accelerometer
import pyupm_adxl345 as adxl345
# Create an I2C accelerometer object
adxl = adxl345.Adxl345(0)
while True:
    adxl.update() # Update the data
    raw = adxl.getRawValues() # Read raw sensor data
    force = adxl.getAcceleration() # Read acceleration force (g)

    forceX=format(force[0],'.2f')
    forceY=format(force[1],'.2f')
    forceZ=format(force[2],'.2f')

sleep(2)
Classifying the various activities
The training file contains instances of the various activities classified as;
0-walking
1-running/jogging
2-up/down staircase
3-resting
Below is the screenshot of a small section of the training file

Running a grid search to determine the best value for C
The parameter C controls the tradeoff between errors of the SVM on training data and margin maximization. C is used during the training phase and says how much outliers are taken into account in calculating Support Vectors.
from svmutil import *
import numpy as nu

param = svm_parameter("-q -h 0")
y, x = svm_read_problem('activity.ds')
problem = svm_problem(y[:100], x[:100])
results = []
for c in range(-10,20):
  for g in range(-10,5):
    param.C, param.gamma = 2**c, 2**g
    m = svm_train(problem,param)
    p_lbl, p_acc, p_val = svm_predict(y[100:],x[100:],m)
    results.append([param.C, param.gamma, p_acc[0]])

bestIdx = nu.argmax(nu.array(results)[:,2])

print results[bestIdx]

Classifying various user activities
#load the LIBSVM shared library:
from svmutil import *
#Construct an svm_problem instance where the activity.ds is the dataset with the training data
y, x = svm_read_problem('activity.ds')
where y is the tuple of labels representing the various activities and x is a tuple of data instances representing acceleration values from x,y and z axes

m = svm_train(y[0:], x[0:], '-c 0.03125 -h 0 -b 1 -q')
#y[0:] and x[0:] means we train the model on the whole dataset array from the first instance[0] to the last
#-h disable shrinking heuristics
#-c : set the cost parameter C of C-SVC
#-q: quiet mode (no outputs)

values=[[float(forceX),float(forceY), float(forceZ)]]
#forceX,forceY and forceZ are data instances of the accelerometer values in x,y,z axes

 p_labels,p_acc,p_values = svm_predict([0]*len(values),values,m])
#pass the accelerometer values for prediction in the svm_predict() method which returns
#p_labels: a list of predicted labels   p_acc: a tuple including accuracy and p_values: a list of decision values or probability estimates (if '-b 1' is specified)
print p_labels
#output the predicted labels to represent the predicted activity

Part 2. Node.Js Implementation
Create a new project directory in the board’s home root folder and install node-svm:
npm install node-svm
Copy the build and lib folder from the node-modules/node-svm to the project directory.
Next install the packages required by node-svm by running:
npm install <package-name>
The packages are Stringify-object, Mout, Graceful-fs, Optimist, Osenv, Numeric, Q and underscore.
Reading data from the ADXL345 accelerometer
Reading data from the ADXL345 accelerometer
var adxl345 = require('jsupm_adxl345');
var adxl = new adxl345.Adxl345(0);
setInterval(function()
{
adxl.update();
var raw = adxl.getRawValues();
var force = adxl.getAcceleration();
var rawvalues = raw.getitem(0) + " " + raw.getitem(1) + " " + raw.getitem(2);
var forceX=force.getitem(0).toFixed(2);
var forceY=force.getitem(1).toFixed(2);
var forceZ=force.getitem(2).toFixed(2);
}, 2000);
We can now write the code to classify user activity using the value of c we determined from running the grid search using Python in part 1.
var so = require('stringify-object');
var svm = require('./lib');
var numeric = require('numeric');
var fs = require('fs');
var fileName = './activity.ds';
var clf = new svm.CSVC({
c: 0.03125,
normalize: false,
reduce: false,
});
svm.read(fileName)
.then(function (dataset) {
return clf.train(dataset)
.progress(function (progress) {
console.log('training progress: %d%', Math.round(progress * 100));
});
})
.spread(function (model, report) {
console.log('SVM trained. \nReport:\n%s', so(report));
}).done(function () {
console.log('done.');
});
var prediction=clf.predictSync([forceX, forceY, forceZ]);
var probability=clf.predictProbabilitiesSync([forceX, forceY, forceZ]);
console.log(prediction);

Summary
The project covers how to determine the training parameters of the classifier using a grid search and running the classifier to be able to accurately predict various activities using LIBSVM in both Python and node.js. SVMs require a lot for processing power and memory; the Intel® Edison board delivers effectively on these requirements thus making the project a success. What will you make?
