In my few previous blog posts, I have explained how we can customize the Debugging windows view during debugging of application using “DebuggerBrowseable“ attributes and “DebuggerDisplay”, then I have also explained the use of “DubuggerHidden” attribute which tells the Visual Studio debugger that the method is hidden from the debugging process and while debugging. In this blog post, I am going to explain one similar feature of “DebuggerHidden” attribute, named “DebuggerStepThrough”.
Marking a piece of code using DebuggerStepThrough attribute tells the Visual Studio debugger that the code block will be stepped over from the debugging process. You can mark methods, properties with DebuggerStepThrough attributes where you don’t want to stop your code to break.
If there is any break point inside a code section which is marked as “DebuggerStepThrough” attributes, that code block will be marked as “[External code]” in stack Trace. Whereas “Debugger hidden” attributes which aren't marked are External code.

Let’s assume that you have the below sample code snippet where “Method1()” marked as with debuggerStepThrough() attributes.

Now if you run your application, the debugger will stop at line number 37 inside Method2() [Note: Line number I am using only for reference of that above code], though you have a break point at Line number 20, inside method1(). But, as Method1() has marked as “DebuggerStepThrough”, the breakpoint didn’t hit over there.
While the breakpoint stopped at the method2(), just open the call stack window as shown below:

As per the about Call stack window, Live breakpoint position is Line number 37 which is inside the Method2(), and method2() has been called from method1(). Though the method1() has a break point, it doesn’t hit due to “DebuggerStepThrough” attributes.
The breakpoint position of method1() has been marked as “[ExternalCode]”. To make it sure, just right click on “Call Stack” window and select “Show External Code” option.

This change will show you the exact line from where it has been called which is marked as “External Code”. The below screen shows the exact line of call for the external code which was marked as “DebuggerStepThrough”.

Once you select the “Show External code” option, you can see the exact line number from where the method2() was called. You can also verify the same by just clicking one of the lines at the call stack window.
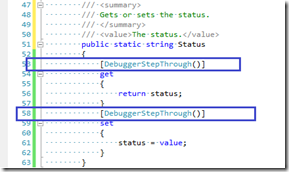
You can apply the “DebuggerStepThrough” attributes with properties also. But for that, you have to apply the attributes to get and set statement not with the properties name.

Summary
In this blog post, I have explained how we can use “DebuggerStepThrough” attributes to a piece of code so that the code is stepped over while debugging. If there is any breakpoint inside that code block, that will be marked as “External Code”. This thing save a lot of time of development if you don’t want to step into some code always or unless they raise some exception. This is also very much a time saver when you applied it for properties too.
Hope this will help you!
Abhijit
Filed under:
General,
Tips and Tricks,
Visual Studio,
Visual Studio 2010 


