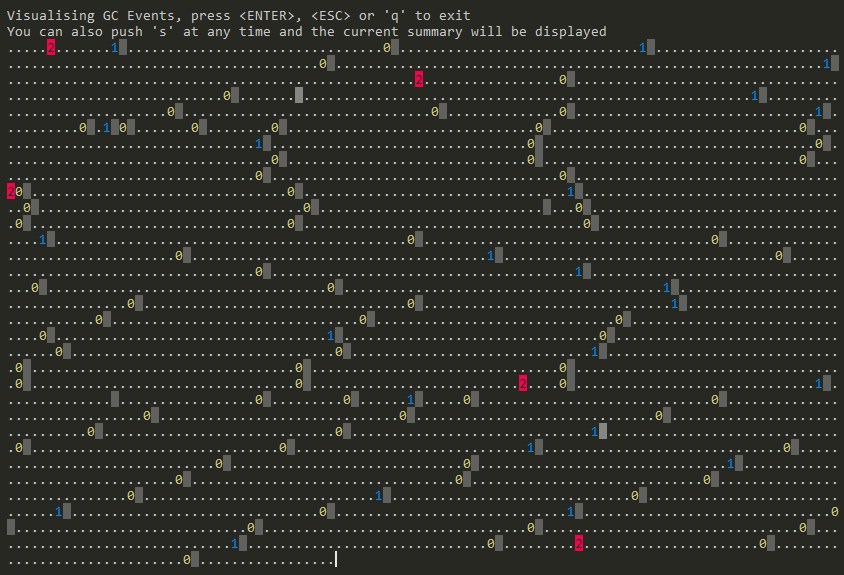
As part of an ongoing attempt to learn more about how a real-life Garbage Collector (GC) works (see part 1) and after being inspired by Julia Evans’ excellent post gzip + poetry = awesome I spent a some time writing a tool to enable a live visualisation of the .NET GC in action.
The output from the tool is shown below, click to Play/Stop (direct link to gif). The full source is available if you want to take a look.


Capturing GC Events in .NET
Fortunately there is a straight-forward way to capture the raw GC related events, using the excellent TraceEvent library that provides a wrapper over the underlying ETW Events the .NET GC outputs.
It’s a simple as writing code like this :
session.Source.Clr.GCAllocationTick += allocationData =>
{
    if (ProcessIdsUsedInRuns.Contains(allocationData.ProcessID) == false)
        return;

    totalBytesAllocated += allocationData.AllocationAmount;

    Console.Write(".");
};
Here we are wiring up a callback each time a GCAllocationTick event is fired, other events that are available include GCStart, GCEnd, GCSuspendEEStart, GCRestartEEStart and many more.
As well outputting a visualisation of the raw events, they are also aggregated so that a summary can be produced:
Memory Allocations:
        1,065,720 bytes currently allocated
    1,180,308,804 bytes have been allocated in total
GC Collections:
  16 in total (12 excluding B/G)
     2 - generation 0
     9 - generation 1
     1 - generation 2
     4 - generation 2 (B/G)
Time in GC: 1,300.1 ms (108.34 ms avg)
Time under test: 3,853 ms (33.74 % spent in GC)
Total GC Pause time: 665.9 ms
Largest GC Pause: 75.99 ms
GC Pauses
Most of the visualisation and summary information is relatively easy to calculate, however the timings for the GC pauses are not always straight-forward. Since .NET 4.5 the Server GC has 2 main modes available the new Background GC mode and the existing Foreground/Non-Concurrent one. The .NET Workstation GC has had a Background GC mode since .NET 4.0 and a Concurrent mode before that.
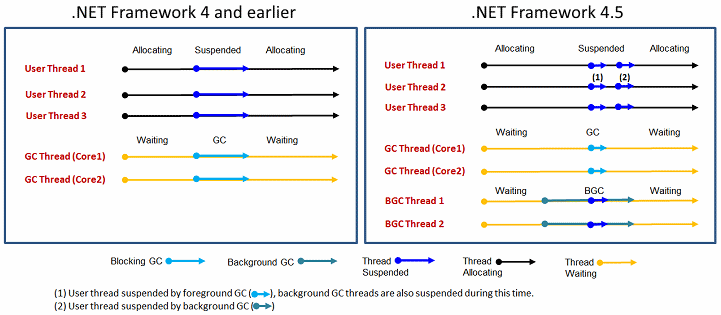
The main benefit of the Background mode is that it reduces GC pauses, or more specifically it reduces the time that the GC has to suspend all the user threads running inside the CLR. The problem with these “stop-the-world” pauses, as they are also known, is that during this time your application can’t continue with whatever it was doing and if the pauses last long enough users will notice.
As you can see in the image below (courtesy of the .NET Blog) , with the newer Background mode in .NET 4.5 the time during which user-threads are suspended is much smaller (the dark blue arrows). They only need to be suspended for part of the GC process, not the entire duration.

Foreground (Blocking) GC flow
So calculating the pauses for a Foreground GC (this means all Gen 0/1 GCs and full blocking GCs) is relatively straightforward, using the info from the excellent blog post by Maoni Stephens the main developer on the .NET GC:
GCSuspendEE_V1GCSuspendEEEnd_V1 <– suspension is doneGCStart_V1GCEnd_V1 <– actual GC is doneGCRestartEEBegin_V1GCRestartEEEnd_V1 <– resumption is done.
So the pause is just the difference between the timestamp of the GCSuspendEEEnd_V1 event and that of the GCRestartEEEnd_V1.
Background GC flow
However for Background GC (Gen 2) it is more complicated, again from Maoni’s blog post:
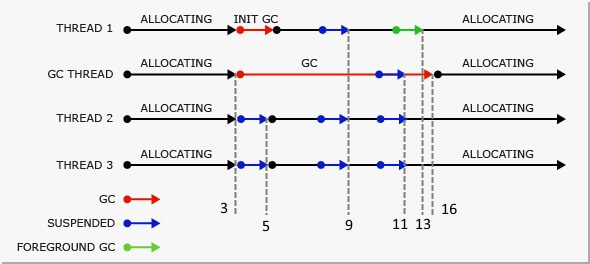
GCSuspendEE_V1GCSuspendEEEnd_V1GCStart_V1 <– Background GC startsGCRestartEEBegin_V1GCRestartEEEnd_V1 <– done with the initial suspensionGCSuspendEE_V1GCSuspendEEEnd_V1GCRestartEEBegin_V1GCRestartEEEnd_V1 <– done with Background GC’s own suspensionGCSuspendEE_V1GCSuspendEEEnd_V1 <– suspension for Foreground GC is doneGCStart_V1GCEnd_V1 <– Foreground GC is doneGCRestartEEBegin_V1GCRestartEEEnd_V1 <– resumption for Foreground GC is doneGCEnd_V1 <– Background GC ends
It’s a bit easier to understand these steps by using an annotated version of the image from the MSDN page on GC (the numbers along the bottom correspond to the steps above)

But there’s a few caveats that make it trickier to calculate the actual time:
Of course there could be more than one foreground GC, there could be 0+ between line 5) and 6), and more than one between line 9) and 16).
We may also decide to do an ephemeral GC before we start the BGC (as BGC is meant for gen2) so you might also see an ephemeral GC between line 3) and 4) – the only difference between it and a normal ephemeral GC is you wouldn’t see its own suspension and resumption events as we already suspended/resumed for BGC purpose.
Age of Ascent - GC Pauses
Finally, if you want a more dramatic way of visualising a “Stop the World” or more accurately a “Stop the Universe” GC pause, take a look at the video below. The GC pause starts at around 7 seconds in (credit to Ben Adams and Age of Ascent)
Discuss this post on Hacker News
The post Visualising the .NET Garbage Collector first appeared on my blog Performance is a Feature!
CodeProject
