Get access to the new Intel® IoT Developer Kit, a complete hardware and software solution that allows developers to create exciting new solutions with the Intel® Galileo and Intel® Edison boards. Visit the Intel® Developer Zone for IoT.
To better understand this article and example, you are recommended to have an experience to use Intel® System Studio for Microcontroller to build the example code before. Here is the tutorial link you may take a look at first. You can visit Mouser Electronics or other global hardware distributor’s online store to purchase D2000 development boards and start to play this default IDE software by your own. Even having no any hardware, you can still browse the Quart D2000 BSP by just downloading developer IDE software, Intel System Studio for Microcontroller, which contains the D2000, Quark SE’s BSPs, compiler, openOCD debugger and so on. Here is the downloading link.
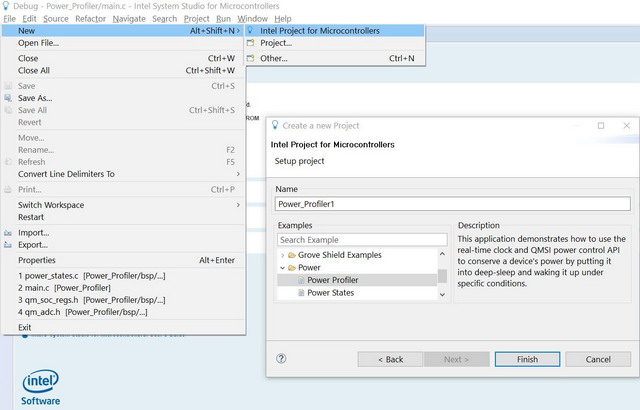
Today, we will browse <Power_Profiler> this code example built-in within ISSM and review D2000 c-states. First, the figure below shows you how to locate this code example. By clicking new a project in Intel System Studio for Microcontroller (For writing convenience, will be used to replace ISSM Intel System Studio for Microcontroller in the following context below), you can easily use the new project dialog window to create this <Power Profiler> example project. And you should have no problems to build this project and flash it to the D2000 development board by using ISSM 2017 updates 1.

C-states revealed in <Power_Profiler>
<Power_Profiler> serves as an example to perform the test to iteratively enter different low power (sleep) states defined in power_states.c. The RTC (Real Time Clock) interrupt event is also setup to wake system from these sleep states by every 500ms (or shorter) with a LED blink signal.
According to Quark’s BSP QSMI 1.1 in ISSM 2017 updates 1, the D2000’s power states can be categorized as the followings.
#define ENTER_C1() power_cpu_halt()
#define ENTER_C2() power_soc_sleep()
#define ENTER_C2LP() power_soc_deep_sleep()
D2000 supports 4 system root clock frequencies of 4/8/16/32Mhz. And there are 8 clock dividers allow you to try lower frequency down to ~128 KHz to optimize the power usage. Plus, it allows the possibility to run entire SoC at minimum 32.768 KHz as a working frequency for ultra-low power usage. You can do the frequency switch by using the following code snippets.
clk_sys_set_mode(CLK_SYS_CRYSTAL_OSC, CLK_SYS_DIV_8);
clk_sys_set_mode(CLK_SYS_CRYSTAL_OSC, CLK_SYS_DIV_4);
clk_sys_set_mode(CLK_SYS_CRYSTAL_OSC, CLK_SYS_DIV_2);
clk_sys_set_mode(CLK_SYS_CRYSTAL_OSC, CLK_SYS_DIV_1);
clk_sys_set_mode(CLK_SYS_RTC_OSC, CLK_SYS_DIV_1);
Question: What is SOC_WATCH_LOG_EVENT macro for?
You may be curious about where the profiler part is. (Me too) If you are familiar with Intel System Studio, you may notify one tool named SoCWatch used to collect power related metrics for IA platforms of both client and server segments. This "SoC Watch" keyword happens to be in the RTC interrupt callback function of this code example; SOC_WATCH_LOG_EVENT macro is used to record events. Check the code below.
void rtc_example_callback(void)
{
SOC_WATCH_LOG_EVENT(SOCW_EVENT_INTERRUPT, QM_IRQ_RTC_0_VECTOR);
Once you look into the soc_watch_log_app_event, you should find the event logs are stored in one data structure <sw_profiling_event_buffer>. how we can use it for profiling? It’s still a question now. Guess we will need to wait for a while to see the power profiler tool release in the future.
Reference
D2000 Data Sheet in D2000 documentation
Intel® Quark™ Microcontroller Developer Kit D2000 Accelerometer and PWM: Lab Guide
