Introduction
The most important feature of AngularJS is directive because of its extensionality features of HTML tags with attributes and reusability. One can play with AngularJS code if he/she knows creating custom directives and using it.
Angular Google chart is a very beneficial extension by Google for plotting various types of charts.
In this article, the simplest steps required for creating custom directives which in case plots different types of charts according to the chart type given by the user are explained.
The rest of the article is organized as Requirements, Methodology, Results, Conclusion and References.
Requirements
For plotting graph using Angular Google chart, the corresponding JavaScript file must be included in the project. The required file named ng-google-chart.js can be downloaded from here.
Also don't forget to set the reference of ng-google-chart.js to your HTML page.
Methodology
1. Creating Custom Directive and Using google-chart
First we need to create a reusable and highly maintainable custom directive which in case plot charts with respect to the data passed from controller. Let us see the example of the custom directive and its explanations.
app.directive('appColumnchart',
function () {
return {
scope: {
filterBy: '=ngModel',
data: '=data',
title: '=title',
stacked: '=stacked',
type: '@'
},
restrict: 'EA',
transclude: false,
template:
'<div google-chart
chart="colChartObject"></div>',
link: function ($scope) {
$scope.colChartObject = {};
$scope.colChartObject.type = $scope.type;
$scope.colChartObject.displayed = true;
$scope.Colors = [
['#CB7472', '#A895BF', '#F8A769', '#A7514F', '#C0504D', '#9BBB59'],
['#7399C9', '#A8C472', '#8AC8D9', '#426690', '#4BACC6', '#8064A2'],
['#4F81BD', '#C0504D', '#9BBB59', '#A895BF', '#F8A769', '#A7514F'],
['#F79646', '#4BACC6', '#8064A2', '#A8C472', '#8AC8D9', '#426690']
];
$scope.colChartObject.data = $scope.data;
$scope.colChartObject.options = {
title: $scope.title,
isStacked: $scope.stacked,
titleTextStyle: { color: '#000000',
fontName: 'Open Sans', fontSize: 16,
bold: true, italic: false },
height: 250,
colors: $scope.Colors[Math.floor(Math.random() * $scope.Colors.length)]
};
}
}
});
Here, a custom directive named appColumnchart is created. It receives different variables passed from controller via isolated scope.
The directive uses google-chart directive for plotting charts as template, i.e.:
<div google-chart chart="colChartObject"></div>
Here, we need to set the chart attribute. Chart attribute has different properties namely type, data, options, etc. Again, options property has several sub properties which are mentioned and explained in the above code.
2. Creating Required Controller
Then, we need to create the controller in AngularJS through which data can be passed to directive.
Here is the example of demo controller where data is initialized and hardcoded but in real, data might be needed from DB. For simplicity, here value is in hardcoded form.
app.controller('ChartController',
[
function () {
$scope.chartData= {
cols: [
{
id: "month",
label: "Month",
type: "string"
},
{
id: "Tables-id",
label: "Tables",
type: "number"
},
{
id: "Chairs-id",
label: "Chairs",
type: "number"
},
{
id: "Bed-id",
label: "Bed",
type: "number"
},
{
id: "Desk-id",
label: "Desk",
type: "number"
}
],
rows: [
{
c: [
{
v: "January"
},
{
v: 19,
f: "19 Tables"
},
{
v: 12,
f: "12 Chairs"
},
{
v: 7,
f: "7 Beds"
},
{
v: 4,
f: "4 Desks"
}
]
},
{
c: [
{
v: "February"
},
{
v: 13
},
{
v: 1,
f: "only 1unit"
},
{
v: 12
},
{
v: 2
}
]
},
{
c: [
{
v: "March"
},
{
v: 24
},
{
v: 5
},
{
v: 11
},
{
v: 6
}
]
}
]
},
}
]);
The chartData in the above code is passed to custom directive which then passes data to google-chart directive by which chart is plotted.
3. Using in HTML
The created custom directive can be used in HTML as follows:
Along with chart data, we need to pass title (which will be displayed on top of the chart), stacked (based on true/false value, the output will be stacked or non-stacked), type (based on the type the chart will be drawn).
Results
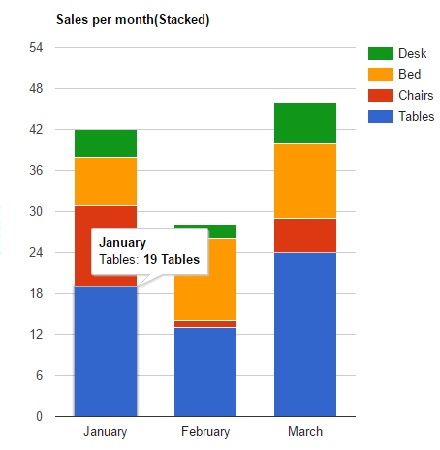
Example 1: Column Chart (stacked)
<div ng-controller="ChartController">
  <app-columnchart
   data="chartData" title="'Sales per month(Stacked)'"
   stacked="true" type="ColumnChart" />
</div>
For column chart, type should be "ColumnChart". Here, stacked="true" is passed for stacked output.
The output of the above data and the input HTML is as below:

Example 2: Column Chart (non-stacked)
<div ng-controller="ChartController">
  <app-columnchart
   data="chartData" title="'Sales per month(non-Stacked)'"
   stacked="false" type="ColumnChart" />
</div>
Here stacked="false" is passed.
The output of the above data and the input HTML is as below:

Example 3: Bar Chart
<div ng-controller="ChartController">
  <app-columnchart
   data="chartData" title="'Sales per month'"
   stacked="false" type="BarChart" />
</div>
For bar chart, type should be "BarChart".
The output of the above data and the input HTML is as below:

Conclusion
In this article, a simpler way to create custom directive which plots different types of graph according to the user input and need is mentioned. I hope you enjoy reading this and somehow it is useful.
References
- Directive in AngularJs
- Angular Google charts
