Introduction
If you are not familiar with the KnpLabs KnpPaginatorBundle and how to use it with Symfony applications, you might want to read up on it. The GitHub page does say it is a Symfony 2 bundle, however, it does work perfectly with Symfony 3.
Why would you use it? If you want to have pages where you show all of your database Entity results, this is a perfect solution, since instead of showing all the results, it shows pages of results. You would simply click through the pages of results, also columns are sortable.
I have some applications that use this bundle, and just recently noticed that a large number of database queries were being made on one page, which is not acceptable in a production environment. This article is about how I found that out and what I did to significantly improve performance.
Symfony Debug URL
Most newbies that come from a CakePHP or Drupal environment (and true newbies) are not at all familiar with the Symfony debug URL. To access the debug URL, you simply append “app_dev.php” after the hostname followed by the route. Let’s say you had a route in your controller called “home”, and your hostname was called “example.com”, then you would use the following debug URL:
http:
At the bottom of the page you will now see the debug URL like the screenshot below:

In the above screenshot, the green 200 shows it got a 200 status code, and the “@ homepage” indicates the route retrieved is “homepage”. The “8 in 15.82 ms” indicates 8 database queries in 15.82 milliseconds. On the far right is the version of Symfony (3.2.8), and you can click on the big “X” to close the debug toolbar.
Too Many Queries
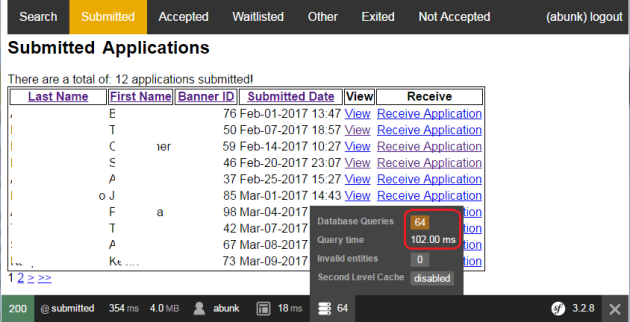
On my submitted route I noticed the color of the database queries section was yellow, which normally indicates a warning. It looked like the following:

If you hover over the database queries you will also see more details. Below is a screenshot of the full page with data obfuscated so you can see the paginator in action and what is to be expected:

If you actually click on the database queries section of the debug toolbar, it will bring up the Doctrine debug menu showing all the queries that were run and details. This is how I figured out where the excessive queries were coming from (more below).
Original Query
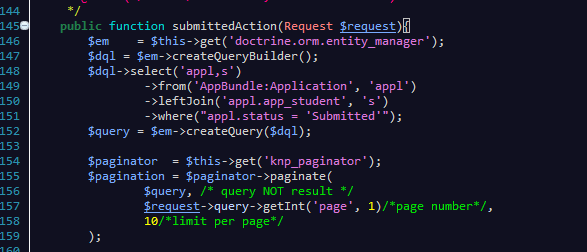
My original query simply selected all columns in my Application and Student Doctrine Entities, which at first I thought was ok, but later realized was the cause of the excess queries. Here is a screenshot of the original Doctrine query in my Eclipse IDE:

I query the Application Entity as “appl” alias, and then join Student on “app_student” which is a OneToOne JoinColumn in Doctrine. The problem with querying all columns of an Entity, is that it will try to get all properties of the Entity, including joined Entities.
Required Columns
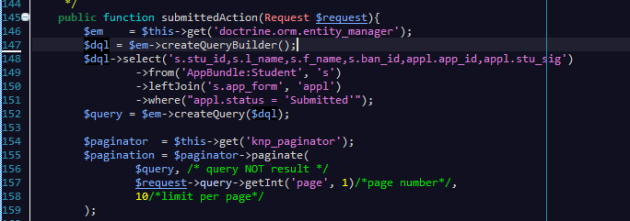
At first I wasn’t sure how to optimize my query, but then I realized I only need to get what was used in my Twig file to render the page. I needed the Student id, first & last names, and ban_id, plus the Application signature. So I first made my select in my Doctrine Query Builder like so:
$dql->select('s.stu_id,s.l_name,s.f_name,s.ban_id,appl.stu_sig')
However, if you do something like that, you mos likely will get an error:
Cannot select entity through identification variables without choosing at least one root entity alias.
This is because “app.app_id” the Application identifier needs to be selected from the alias. I then came up with this final query:

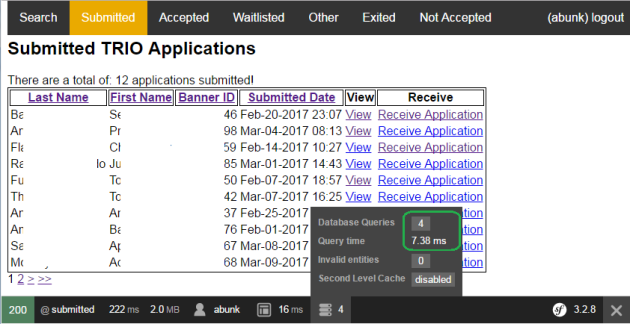
Then when I render the page, you can see the significant improvement:

So the number of queries went from “64” down to “4”, which is incredibly significant.
Lesson learned: Make sure you optimize your Doctrine queries, as they may not be performing exactly as you expect.
Enjoy!


