Introduction
Event Tracing for Windows (ETW, henceforth) is a low-latency API that was indended for debugging all kinds of code that runs on Microsoft Windows, from the most mundane "hello, world" user application to the most obecure type of device driver. Built atop the infrrastructure that underlies the Windows Event Log service, it offers a flexible, loosely coupled framework for logging every imaginable kind of event that can happen during the lifetime of a Windows application or library.
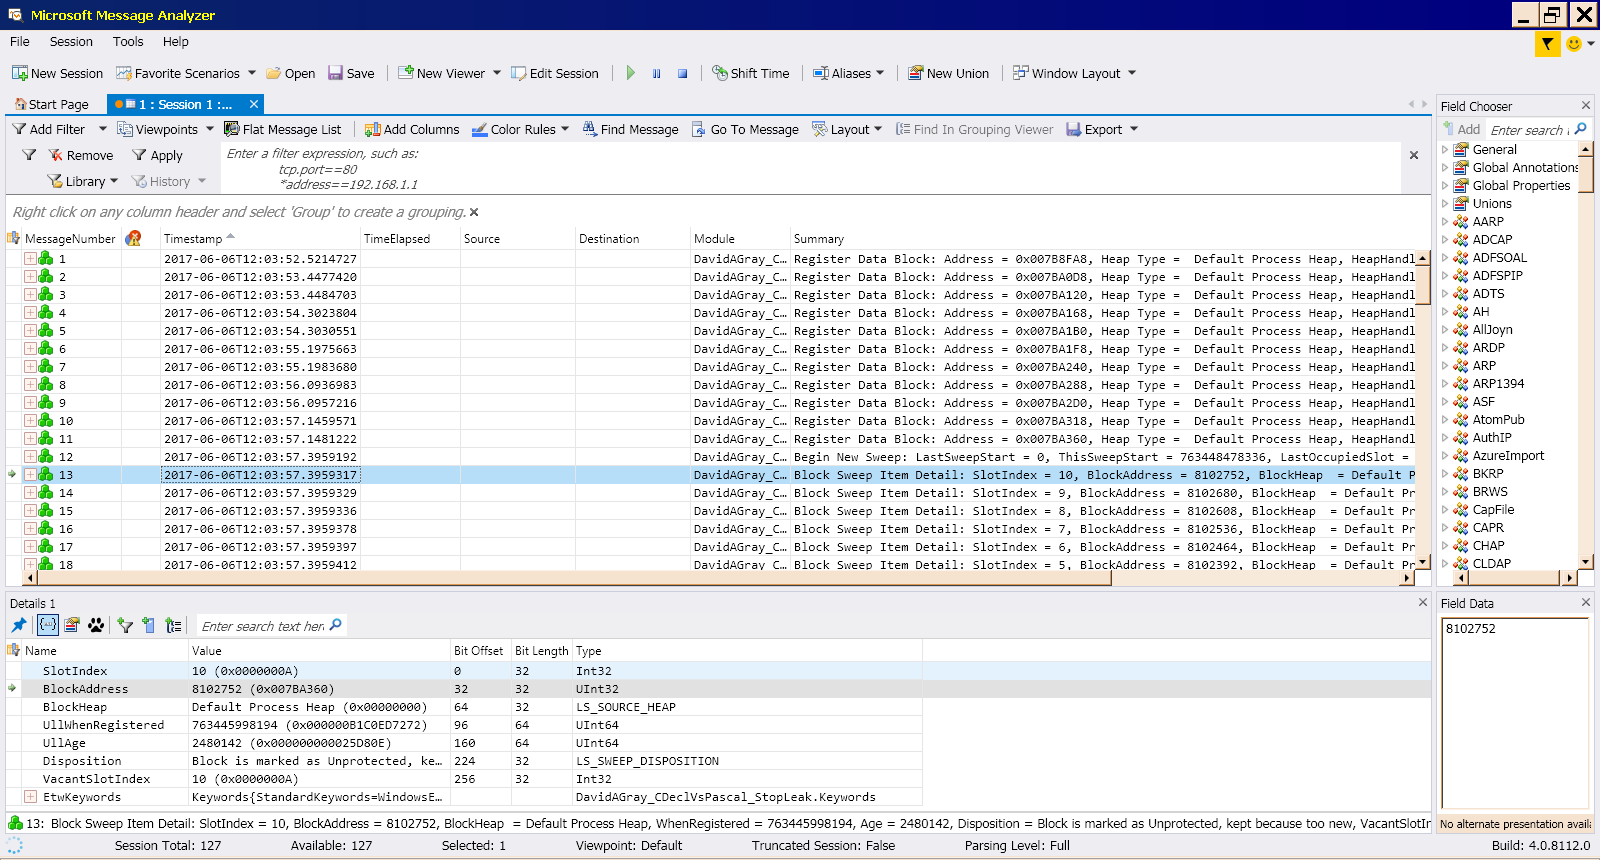
Figure 1 shows the log generated by a set of ETW events as it is rendered by the Microsoft Message Analyzer.
Astute readers will immediately recognize the resemblance of the Microsoft Message Analyzer window shown in Figure 1 to the standard Windows Event Viewer display. While there are differences here and there, their common origin is apparent. The fundamental difference is that the events shown above were raised by a custom ETW provider, which is built into the DLL that prompted the investigation that led to this article.
The most significant difference between ETW events and the more familiar Windows events is evident in the detail grid in the lower third of the window shown in Figure 1, which lists replaceable parameters that are fed into the packet that raises the event. These parameters and their labels enable you to call out internal details, such as machine addresses and enumerated types as they existed in your code when the event arose.
Background
Though event tracing has been available since Windows 2000, Vista introduced a new high performance engine that is shared with the regular event reporting ("eventing" - I didn't make that up. Microsoft did.) infrastructure, and leverages a new Event Provider Manifest in place of the cumbersome Managed Object Format files that were at the center of ETW in Windows 2000. While "classic" event tracing, using MOF files, is still supported, the manifest based reporting that came along with Vista relaxes many restrictions that made ETW both less flexible and less useful.
The title that I chose for this article reflects the way I initially perceived the learning curve until yesterday, when I discovered the Microsoft Message Analyzer (download). Combining it with wevtutil.exe, the Eventing Command Line Utility, and my relatively intimate knowledge of how the Windows Event Log works reduced what seemed like an expedition to the top of Mt. Everest to a much more manageable hike to the top of Pike's Peak.
In preparation for our ascent, it is essential to understand the numerous moving parts that go into a manifest and how they are related. To that end, I offer Table 1, followed by Figure 2, below. Please skim both, then scroll past the picture, where the narrative resumes.
Table 1 summarizes the entities that go into a manifest.| Entity Name | Related Entity Name | Relationship Type | Explanation |
|---|
| Manifest | Event | 1 to Many | A manifest usually defines two or more Events. |
| Event | Manifest | Many to 1 |
| Template | Manifest | Many to Many | Two or more events that use identical parameter lists may share a Template, but one Event is related to at most one template. |
| Field | Template | Many to 1 | A template has one or more associated fields. Unfortunately, field definitions cannot be shared among templates. |
| Map | Field | Many to Many | Many fields, in one or more templates, may share one Map. |
| Opcode | Event | Many to 1 | Each event has at most 1 associated Opcode, but one Opcode may apply to many events. |
| Keyword | Event | Many to Many | Each event has zero or more associated Keywords, and one Keyword may apply to many events. |
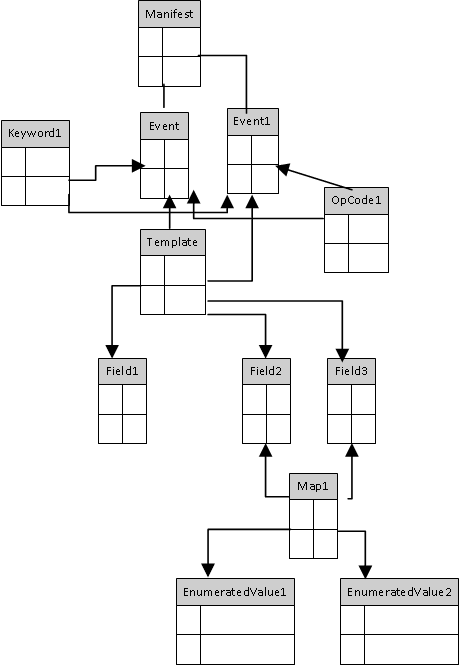
Figure 2 shows the relationships among the objects that go into the event manifest.
For a small project, you can dispense with both Opcodes and Keywords, Both support filtering of large logs generated by complex applications that may incorporate two or more event providers, but they are overkill for a project of the scale that prompted me to learn ETW and write this article. ((On careful examination, the manifest implements Opcodes, but I quickly realized that they were overkill.)
Maps are another matter, though, if your application reports anything remotely resembling an enumerated type. As simple as this application is, it needs three of them.
If you think of the manifest as a small data base, and Figure 2 as its schema, it should be apparent that the schema dicates the order in which the entities must be defined, which is mostly bottom up, roughly as follows.
- The very first required task is to define the Manifest, which has Name, Symbol, and GUID properties.
- Naming follows an established convention,
Company-Product-Component, separated by hyphens. The specified name becomes the name of the .man file in which the definition is persisted, along with the C/C++ header (.h) file that you import into the module(s) that implement the provider, and the Resource Script (.rc) file generated by the Message Compiler. - Since the Symbol property is incorporated into many names that appear in the C/C++ header file, it should follw your established naming convention for symbols. At the very least, the hyphens must give way to underscores, since the symbol must be a valid C name.
- The GUID provides your manifest with an unambiguous identity; use the New button on the Manuscript Generator to fill this box.
- Once you have a maifest to house them,
maps must be defined before anything else except Keywords and Opcode (if you need either). Since you will probably use them, think of map definition as your first required design activity. - Since
Templates depend upon zero or more Maps, they are the next logical entity to get your attention. - An
Event cannot be defined until its associated Template, if any, is defined, along with its Opcode, if it needs one, and its Keywords, if any.
Since it goes without saying that you can edit any entity in any order, the order listed above is the most efficient order in which to define things. Realistically, you will probably do several iterations, especially on your first few manifests. Even with decent planning, I did a couple of iterations before I had a product that satisfied me.
Your Hiking Check List
Continuing with the hiking metaphor, just as summiting Pike's Peak is a nontrivial hike, and an equipment check list is required, so it is with implementing ETW.
ecmangen.exe, the Instrumentation manifest generation tool, is included with the nweest editions of the Microsoft Platform SDK. This graphical tool is the fastest, easiest, most accurate way to generate the manifest for your ETW Provider, a complex XML document that must adhere to a pretty strict DTD. Strictly speaking, both the event provider, the program that raises tracing events, and the event consumer, the program that listens for, preserves, and formats them, use the manifest directly or indirectly..mc.exe, the Message Compiler, transforms the instrumentation manifest generated by ecmangen.exe into the binary Message resource that your Event Provider uses to guide construction of the packet that it sends to the Event Log Service. Since it also comes with the Platform SDK, if you have one, you have the other. Though it can be used at a command prompt, it's much easier to use as part of a Visual Studio project. Setting that up is simple, though not exactly obvious, so I'll show you how when the time comes.rc.exe, the Resource Compiler, has the rather odd job of combining the Message, Manifest, and Version resources into a single binary Resource object file (a COFF formatted file) that is fed to the linkage editor. It comes with the previous two, as part of the Platform SDK. Though it can be used at a command prompt, it's much easier to use as part of a Visual Studio project. I suspect that the Resource Compiler comes with the PSDK because it's required even if you use another compiler and linker, such as GCC, in place of Visual Studio.link.exe, the Microsoft Incremental Linker, rolls everything into a Portable Exectutable (PE) file that Windows can load into a process. This is one of only two checklist items that comes with Microsoft Visual Studio. If you use another compiler, you'll need its linkage editor; they usually come paired.cl.exe, the Microsoft C/C++ Optimizing Compiler is the other Visual Studio component that goes onto your check list. You'll need it, or an alternative C/C++ compiler, to compile your Event Provider source code.wevtutil.exe, the Eventing Command Line Utility, is the only item on this ckeck list that ships with the operating system, and the only one that is normally accessible via the Windows PATH directory list. MessageAnalyzer.exe, the Microsoft Message Analyzer, is a separate download, available from http://www.microsoft.com/en-us/download/details.aspx?id=44226.
Leave the Sherpa in Nepal; you'll do just fine with me as your guide.
If you have the Platform SDK for Windows Vista or later, you can check off items 1 through 3 as installed and ready to use, though investing the time to create desktop shortcuts to the first two, along with items 6 and 7, all in one directory, makes them much easier to use. If you have any edition of Visual Studio, items 4 and 5 are covered, and need no further attention. The same holds true if your preferred C/C++ compiler is GCC. That leaves item 6, which shipped with Windows, and is in your System32 directory, which is in the PATH directory list,, and item 7, which requires a download and installation.
Planning Your Climb
Though by no means as arduous as summiting Everest, parts of the trail are narrow, and a bit of preparation pays for itself.
The following tasks are listed in the order in which you should perform them in ecmangen.exe. My preferred planning tool is Microsoft Excel. Its handy-dandy string functions are great for transforming object names into symbol names. I also use conditional formatting to call my attention to duplicates among sets of items that are expected to be unique. Often as not, I also use formulas to assign serial numbers to such things as events and resource strings.
- Map enumerated types to literals. Each set of literals becomes a Map. Each Map becomes a new optional Output Format for any integral item in your Template. I usually create my maps by copying the enum into a worksheet, whee it can be parsed and numbered.
- Identify the data (parameters) to include with each event; these go into a Template. Each parameter has both an input type and an output type, most of which have defaults that correspond to the input type, and can be accepted as is.
- Supported input types are string (either ANSI or Unicode), signed or unsigned integer of any size (16, 32, and 64 bits are supported), float, double, Boolean, pointer,
GUID, FILETIME, SYSTEMTINE, SID, and Binary. - Except for integers that represent enumerations, the default output type can usually be accepted.
- Integers that reprseent enumerations are assigned a Map as their output type; these automatically go onto the list as each Map is saved. When the parameters are rendered, by a tool such as the Microsoft Message Analyzer, the maps are used to render the appropriate enumeration text in place of the numeric value.
- Define the Templates. Each event for which you want to report one or more parameters requires a Template.
- A Template is a named object that lists the parameters that appear in the message and are shown in the detail box at the bottom of the Message Analyzer window.
- A template lists all of the parameters associated with an event, in their order of appearance in the macro that raises the event.
- If several events accept the same parameters in the same order, they may share a template.
- The label that goes into the template is used in the list displayed by the Message Analyzer in its lower window for the selected message.
- In the message body, you must supply your own label, unless the context is sufficient to identify the parameter.
- Define the Channel that listens for the events. Like Manifests, Channels have a Name and a Symbol, but a Channel doesn't need a GUID.
- There seems to be less of a convention for the naming of Channels. To minimize name proliferation, I named my channel by appending
-Debugging to the manifest name. - As was the case with the manifest symbol name, the Channel symbol name must be a valid C symbol, so the hyphens gave way to underscores. Following my convention for the naming of constants, my symbol names are all upper case, for which Excel came to the rescue again.
- The Type is chosen from a list box, and you want the Type of your Channel to be
Debug. - The Description is for carbon units; so far as I could tell, nothing uses it.
- Identify the events. Each event is assigned a number, which must be unique among the set of events defined in a single manifest. Associate each with at most one Template, which contains conversion instructions for the included parameters.
- You may include parameters that aren't displayed in the body of the main message, but the associated Template must account for every parameter.
- Though event IDs must be unique, they need not be sequential. Following a long established procedure that originated in the days of punched cards, I usually assign event IDs in intervals of either 10 or 100, which allows me to insert numbers without renumbering existing events.
- Compose the messages. A good message should briefly, but clearly describe the associated event, followed by a brief, meaninfgul label for each paramter (data point) that accompanies it.
- Parameters are indicated by placeholder tokens (
%1 through %n, where n is the total number of parameters). - Parameter numbering corresponds to their order of appearance in the macro call that raises the event.
- Parameter numbers must begin at 1 (heads up, C#ers!), and must be sequential, but they may appear in any order in the message body.
- Name your provider. The naming convention is
CompanyName-ProductName-ComponentName; this is the conventional scheme for naming Registry keys, application directories in Program Files, and other application-related directories and objects.
The Ascent
On most mountains, you can take any of several routes to the summit. Since the C# trail is fairly well marked, in the form of other articles, and the project that I happen to be instrumenting is implemented in C++, I'll be taking the C++ route. The fact that parts of this trail are steeper didn't deter me (much!).
The ascent happens in four phases.
- Use
ecmangen.exe to create the manifest. - Use the Message Compiler and Visual Studio to compile the mainfest into a resource-only DLL. In some respects, I am more interested in the like named C/C++ header file that is a by-product of building the DLL.
- Incorporate the by-product C/C++ header into the application, and write the macro calls to raise the events.
- Use the Microsoft Message Analyzer to enable your debug event channel, listen for events, and log them.
The next four sections cover the key points of each step. Since this article is written for an audience of advanced C and C++ programmers, my focus will be on orienting you to the tools, leaving the nitty gritty details for you to explore.
The Lower Slope: Creating the Manifest
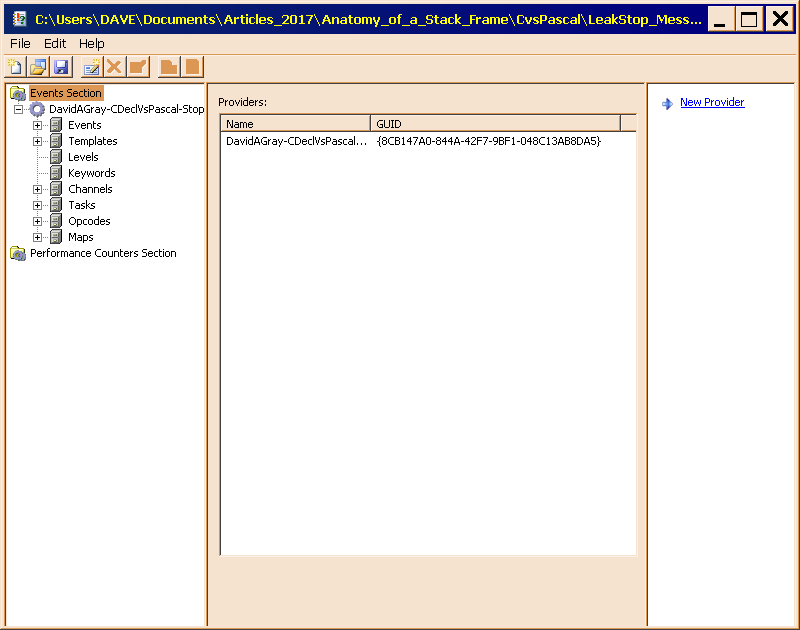 Figure 3 shows the Manifest Generator as it appears with
 LeakStop_EventTraceProvider.man loaded into it.
Figure 3, above, shows the main Manifest Generator window as it apears when the completed manifest is loaded into it, and the Events section is selected.
- Somewhat to my surprise,
ecmangen.exe doesn't have a Most Recently Used (MRU) list, though it remembers the the name of the last directory from which you loaded a file. - Since
ecmangen.exe processes manfests for both event tracing and performance counters, there are two branches, both initially collapsed. When you load a manifest into it, the relevant branch acquires a single node, which you expand to display the view shown above. - Once the tree is expanded, the behavior of this program resembles that of a typical MMC snap-in.
- Although there is a hierarchy, to which I alluded in te previous section, an event and its components occupy a single level in the tree, greatly simplifying editing.
Important: Pay close attention to the tall, narrow window on the right edge of the main window, where you see widgets that look like hyperlinks, each having a plus sign (which does nothing except occupy space) next to ti. When one of those icons says Edit, you must click before you can edit anything in the middle window, where all the interesting stuff happens. When you select Edit, that button is replaced with a pair of Save and Cancel buttons. When you finish making changes, be sure to click the Save button to avoid losing your edits. Obviously, the Cancel button lets you abandon your changes.
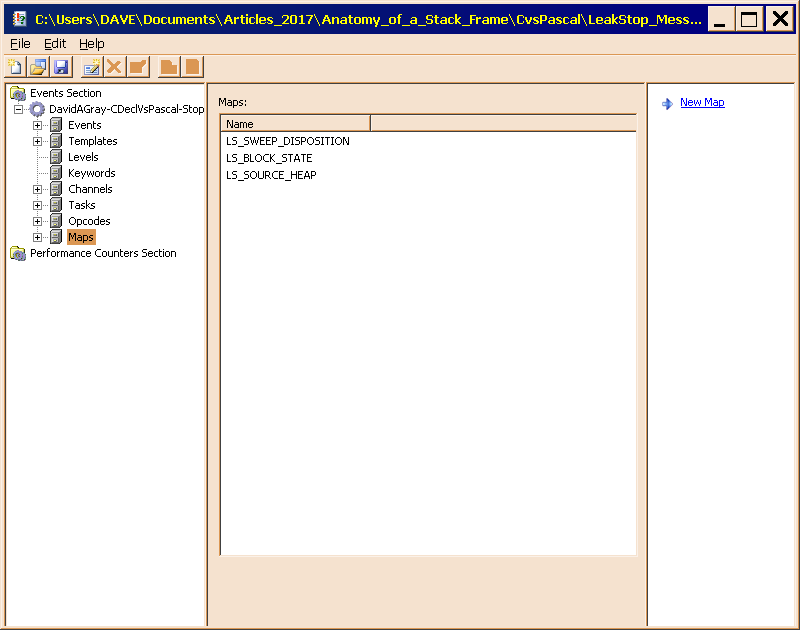 Figure 4 displays the completed map definitions.
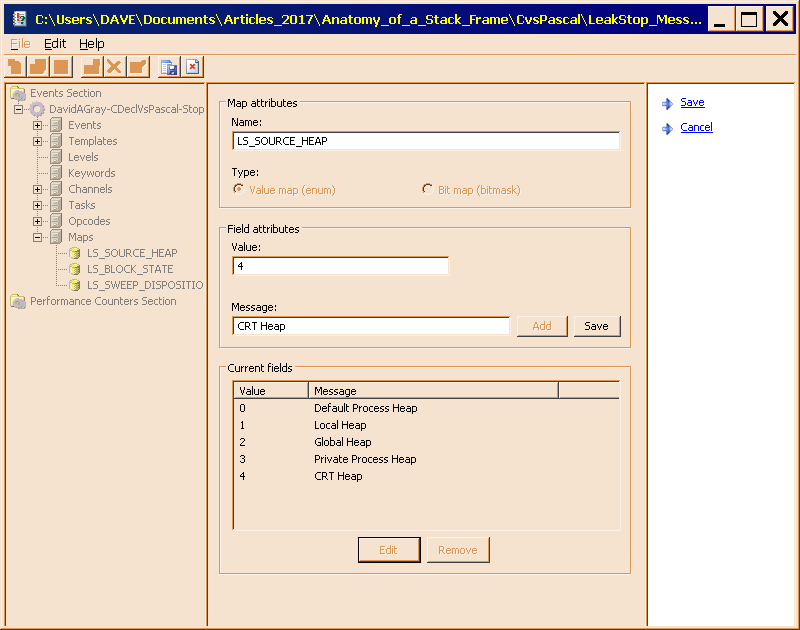 Figure 5 displays the completed
 LS_SOURCE_HEAP map definition.
Figures 4 and 5 show the Maps collection and the completed LS_SOURCE_HEAP map in the LeakStop_EventTraceProvider.man manifest. Notice in Figure 5 that the text is freeform; it need not conform to the constraints of a C variable name. In contrast, the name of the map must be a valid C variable name, since it goes into the generated code.
 Figure 6 is the completed
 DataBlockRegistration parameter template.
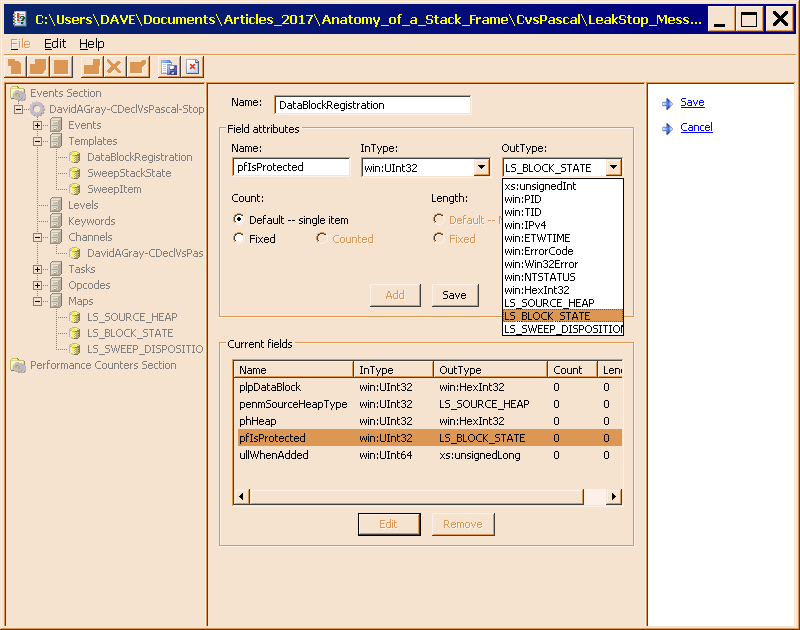 Figure 7 is the
 pfIsProtected parameter, displayed in edit mode, with the list box visible, and the LS_BLOCK_STATE map selected.
Figures 6 and 7 show the the completed DataBlockRegistration parameter template and its pfIsProtected parameter, respectively. In both figures,, notice that the OutType of the penmSourceHeapType is LS_SOURCE_HEAP, while that of the pfIsProtected parameter is LS_BLOCK_STATE. Though techincally a Boolean, I treated it as an enumeration, to gain better control over the text displayed in the report. Additionally, Figure 7 displays the OutType litst box, where you can see the three map names gathered at the bottom of the list.
Finally, I call to your attention the Save button in the middle of the window; shown in Figure 7; this button saves changes to individual parameter definitions. You must also use the Save button in the right-hand pane to save the template, itself.
Did I mention that this trail is full of blind hairpin turns and loose rocks? Now I have; consider yourself warned.
A Short, Steep Climb: Use Visual Studio to Generate Manifest Binaries and Headers
The next portion of the ascent hapens inside Microsoft Visual Studio. Since I wanted to get the DLL created before I went much further, and I have begun to favor keeping most of my resources in dedicated DLLs, I created a resource-only DLL project. Since I had them laid out in a Win32_ResGen.XLXM workbook, which I created in the course of organizing the materials that went into the manifest, the DLL houses not only the event provider manifest, but a set of conventional string resources, along with a Version resource. Please refer to "The Improved Resource String Generator in Action: Thou Shalt Eat Thine Own Dog Food, and Like It!" for details about the Excel workbook.
Configuring a resource-only DLL project is almost the same as configuring any other DLL project. There is only one property, labeled No Entry Point in the Linker page of the project's property sheet, which must be set to Yes, a default override, signaled by the bold display (Figure 8). Several other properties are set away from their defaults, but this is the only one that is a requirement for creating a resource-only DLL.
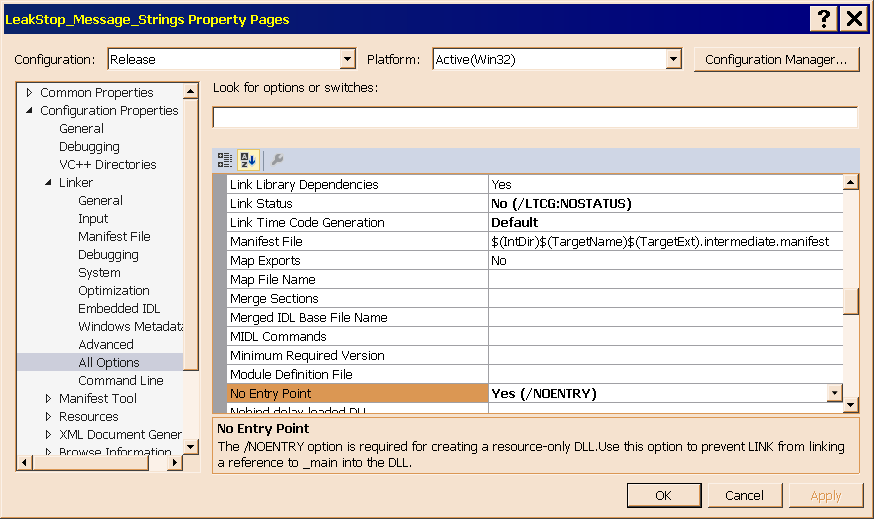 Figure 8 shows the one property that must be changed to mark a DLL as resource-only.
Since it is created outside Visual Studio, the Event Manifest file, LeakStop_EventTraceProvider.man, must be manually added into the project, easily accomplished by way of the Add Existing Item tool, available on both the main Project menu and the Project context (right click) menu. I prefer to use the context menu, because it guarantees that the file goes into the intended project (I've had a few files wind up in the wrong project!).
Once the file is in the project, expand the project in the Solution Explorer, highlight the file, (See Figure 9.) use a right click to activate its context menu, and select Properties, which appears near the bottom of the menu. This action opens a dedicated property sheet for LeakStop_EventTraceProvider.man, shown in Figure 10.
- Make sure that the Item Type is Custom Build Tool.
- Expand the Custom Build Tool item, which appears just below the General page that has the initial focus. Your property sheet should now resemble Figure 11.
- Enter the values shown in Table 2 into the property sheet, and click the Apply button to record the edits.
- Build your project. The narrative continues below Table 2.
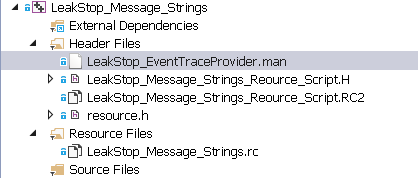
Figure 9 shows the LeakStop_Message_Strings project, with LeakStop_EventTraceProvider.man , the file created by saving the manifest created in ecmangen,exe selected.
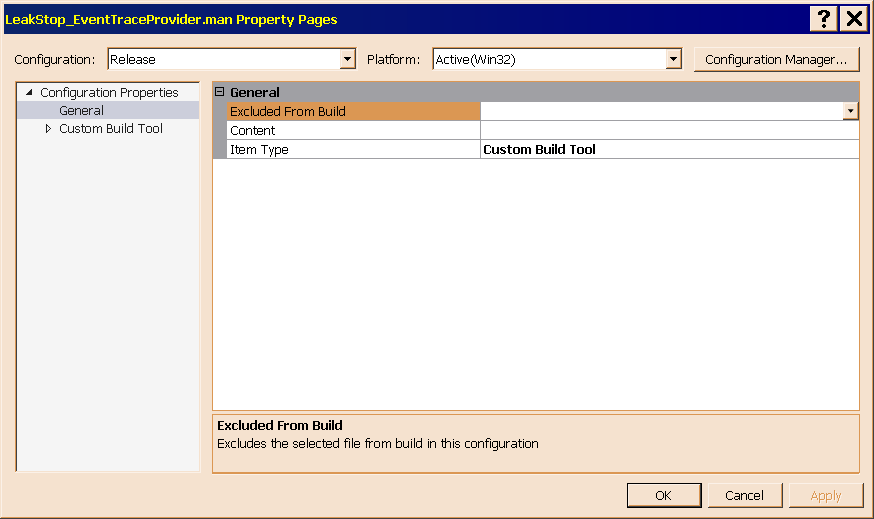 Figure 10 shows the main property sheet of
 LeakStop_EventTraceProvider.man.
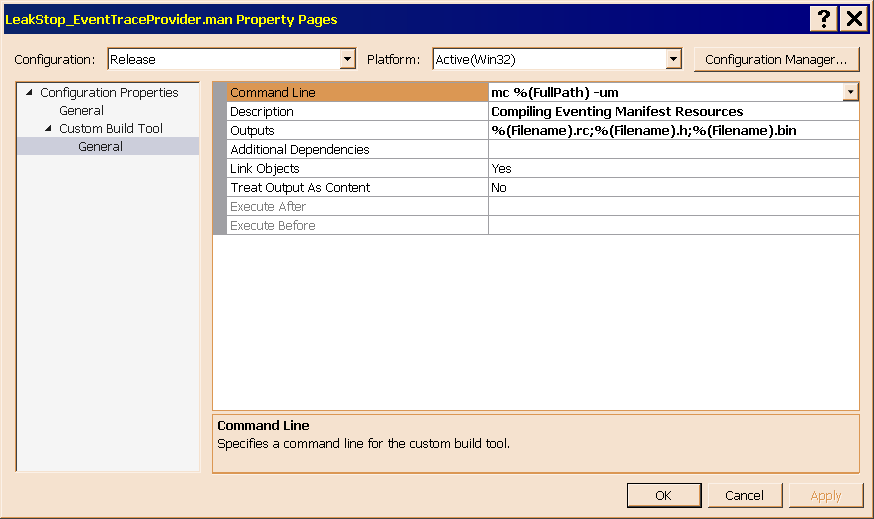 Figure 11 shows the Custom Build Tool configuration page of the
 LeakStop_EventTraceProvider.man property sheet. Table 2, below, lists the properties, so that you don't have to read them off the picture.
Table 2 lists and describes the properties of the Message Compiler tool as it must be configured to process an ETW manifest.| Field Label in IDE | Field Value | Comment |
|---|
| Command Line | mc %(FullPath) -um | Enter this command exactly as shown. The -um switch is required to compile a manifest for a user mode event trace. There are many other switches; for a complete listing, please see Message Compiler (MC.exe) in the MSDN Library. |
| Description | Compiling Eventing Manifest Resources | This text appears in the build logs, and is mostly intended for carbon units. |
| Additional Depndencies | | Leave this field blank. |
| Link Objects | Yes | This is the default value. |
| Treat Output as Content | No | This is the default value. |
LeakStop_EventTraceProvider.rc and LeakStop_EventTraceProvider.h go into the Resource Includes section of the main resource script of the library, LeakStop_Message_Strings.rc.
- Open the Solution Explorer, right click
LeakStop_Message_Strings.rc, and select Add Resource Includes. - Merge them, following the breadcrumbs left by the VBA macro in
Win32_ResGen.XLSM that merged LeakStop_Message_Strings_Reource_Script.H and LeakStop_Message_Strings_Reource_Script.RC2.
Build this project to generate the headers that you'll need for the next phase of your climb.
To wrap up this phase, I call your attention to several features of this project.
- Building the project generates
LeakStop_EventTraceProvider.h, which you must incorporate into the code that raises events, along with LeakStop_EventTraceProvider.rc and several other intermediate files that you can safely ignore. - The other major output of the build is
LeakStop_Message_Strings.dll, which lands in the Release output directory.
- In the sample package, I put a copy in the Debug output directory, so that a debug build can find it, should I need to load it to read its string resources.
- In my working source code tree, I used
FSUTIL.EXE to create a symbolic link, or hard link, to the DLL in the Release directory.
- There is no Debug configuration. This is by design (mine, not theirs!), since there is nothing to gain from having one for a resource DLL, because this type of DLL is always loaded as data, and read by code in other executable files. Even if you built one of each, a byte for byte comparison would show that they are identical.
- I did generate a Map file, because I always do, for every program (DLL or EXE) that I create.
- Another habit that I have recently developed is that of enabling COMDAT folding. For a resource DLL, I suspect this switch does nothing. The same goes for marking the DLL as having safe Structured Exception Handling blocks.
- Since there is no executable code in this library, the C/C++ compiler property page retains its default values; I didn't bother to open it.
Leave Visual Studio open for the next phase of the climb.
A Longer, Gentler Climb: Writing the Code to Raise the Events
For the next phase, the focus shifts to the code that raises trace events, which is in the LeakStop32 project. Two of the three files, LeakStop32_DllMainain.CPP and LS_Memory_Block_Registrars.CPP, define routines that raise trace events.
Most of my projects include a private header, such as LeakStop32_pvt.h, that takes the place of stdafx.h, which I don't use, because I dispense with compiled headers. I began dispensing with them when I was developing DLLs that supported both ANSI (narrow character) and Unicode (wide character) implementations of functions that accepted and/or returned strings. Such DLLs cannot use compiled headers, because the headers must be expanded with UNICODE defined when the wide character code compiles, and with it undefined when the narrow character code compiles.
Since I am not using compiled headers, I put everything into the private header, even resource.h, which most developers include as needed into individual source modules.
#define WIN32_LEAN_AND_MEAN                                                            // Exclude rarely-used stuff from Windows headers
#define _WIN32_WINNT                    0x0601                                        // Make the functions that require Windows 7 or newer visible.

#include "..\Common\StandardMacros_DAG.H"                                            // Standard headers in the correct order
#include "..\Common\LeakStop32.H"                                                    // Library declarations

#include ".\FreeSlotsStack.H"                                                        // CFreeSlotsStack class declaration

#include "..\LeakStop_Message_Strings\LeakStop_EventTraceProvider.h"                // This header declares the Event Tracing for Windows interface.
#include "..\LeakStop_Message_Strings\LeakStop_Message_Strings_Reource_Script.H"    // This header grants access to everything as regular resource strings.

#include ".\resource.h"                                                                // Library resources (mostly strings) - Redundant, now that everything is in LeakStop_Message_Strings.dll.
Listing 1 demonstrates the clever way in which I included the two headers associated with LeakStop_Message_Strings.dll.
Listing 1, above, shows the interesting part of LeakStop32_pvt.h, which appears near the top of the file, where I concentrate my #include directives. LeakStop_Message_Strings_Reource_Script.H, the second of the two headers that are associated with the resource DLL, was generated by one of the two VBA macros in Win32_ResGen.XLSM, which also generated LeakStop_Message_Strings_Reource_Script.RC2, and edited LeakStop_Message_Strings.rc to include both. That VBA macro takes all of the work, along with the high risk of errors, out of using and maintaining read only resource strings in Resource Include files.
Listing 2 shows the most interesting parts of LeakStop_EventTraceProvider.h, which defines a set of macros that eliminate the guesswork from raising trace events in C and C++ code.
#ifndef EventRegisterDavidAGray_CDeclVsPascal_StopLeak
#define EventRegisterDavidAGray_CDeclVsPascal_StopLeak() McGenEventRegister(&DAVIDAGRAY_CDECLVSPASCAL_STOPLEAK, McGenControlCallbackV2, &DAVIDAGRAY_CDECLVSPASCAL_STOPLEAK_Context, &DavidAGray_CDeclVsPascal_StopLeakHandle)
#endif
#ifndef EventUnregisterDavidAGray_CDeclVsPascal_StopLeak
#define EventUnregisterDavidAGray_CDeclVsPascal_StopLeak() McGenEventUnregister(&DavidAGray_CDeclVsPascal_StopLeakHandle)
#endif
#define EventWriteERR_CFREESLOTSSTACK_GROWSTACK_NO_MEMORY()\
EventEnabledERR_CFREESLOTSSTACK_GROWSTACK_NO_MEMORY() ?\
TemplateEventDescriptor(DavidAGray_CDeclVsPascal_StopLeakHandle, &ERR_CFREESLOTSSTACK_GROWSTACK_NO_MEMORY)\
: ERROR_SUCCESS\
#define EventWriteERR_CFREESLOTSSTACK_CFREESLOTSSTACK_NO_MEMORY()\
EventEnabledERR_CFREESLOTSSTACK_CFREESLOTSSTACK_NO_MEMORY() ?\
TemplateEventDescriptor(DavidAGray_CDeclVsPascal_StopLeakHandle, &ERR_CFREESLOTSSTACK_CFREESLOTSSTACK_NO_MEMORY)\
: ERROR_SUCCESS\
#define EventWriteERR_SWEEPSTACK_BAD_HEAP_129()\
EventEnabledERR_SWEEPSTACK_BAD_HEAP_129() ?\
TemplateEventDescriptor(DavidAGray_CDeclVsPascal_StopLeakHandle, &ERR_SWEEPSTACK_BAD_HEAP_129)\
: ERROR_SUCCESS\
#define EventWriteERR_SWEEPSTACK_BAD_HEAP_146()\
EventEnabledERR_SWEEPSTACK_BAD_HEAP_146() ?\
TemplateEventDescriptor(DavidAGray_CDeclVsPascal_StopLeakHandle, &ERR_SWEEPSTACK_BAD_HEAP_146)\
: ERROR_SUCCESS\
#define EventWriteERR_SWEEPSTACK_BAD_HEAP_162()\
EventEnabledERR_SWEEPSTACK_BAD_HEAP_162() ?\
TemplateEventDescriptor(DavidAGray_CDeclVsPascal_StopLeakHandle, &ERR_SWEEPSTACK_BAD_HEAP_162)\
: ERROR_SUCCESS\
#define EventWriteERR_SWEEPSTACK_ARITH_FAIL()\
EventEnabledERR_SWEEPSTACK_ARITH_FAIL() ?\
TemplateEventDescriptor(DavidAGray_CDeclVsPascal_StopLeakHandle, &ERR_SWEEPSTACK_ARITH_FAIL)\
: ERROR_SUCCESS\
#define EventWriteERR_PVT_GETSLOTINDEX_NO_MEMORY()\
EventEnabledERR_PVT_GETSLOTINDEX_NO_MEMORY() ?\
TemplateEventDescriptor(DavidAGray_CDeclVsPascal_StopLeakHandle, &ERR_PVT_GETSLOTINDEX_NO_MEMORY)\
: ERROR_SUCCESS\
#define EventWriteEVT_DataBlockRegistration(plpDataBlock, penmSourceHeapType, phHeap, pfIsProtected, ullWhenAdded)\
EventEnabledEVT_DataBlockRegistration() ?\
Template_qqqqx(DavidAGray_CDeclVsPascal_StopLeakHandle, &EVT_DataBlockRegistration, plpDataBlock, penmSourceHeapType, phHeap, pfIsProtected, ullWhenAdded)\
: ERROR_SUCCESS\
#define EventWriteEVT_SweepStackState(ullmLastSweepStart, ullmThisSweepStart, intLastOccupiedSlot, intTotalSlots)\
EventEnabledEVT_SweepStackState() ?\
Template_xxdd(DavidAGray_CDeclVsPascal_StopLeakHandle, &EVT_SweepStackState, ullmLastSweepStart, ullmThisSweepStart, intLastOccupiedSlot, intTotalSlots)\
: ERROR_SUCCESS\
#define EventWriteEVT_SweepItem(SlotIndex, BlockAddress, BlockHeap, ullWhenRegistered, ullAge, Disposition, VacantSlotIndex)\
EventEnabledEVT_SweepItem() ?\
Template_dqqxxqd(DavidAGray_CDeclVsPascal_StopLeakHandle, &EVT_SweepItem, SlotIndex, BlockAddress, BlockHeap, ullWhenRegistered, ullAge, Disposition, VacantSlotIndex)\
: ERROR_SUCCESS\
Listing 2 shows the interesting bits of LeakStop_EventTraceProvider.h, which consist of the macros that generate the function calls that raise the tracing events. Since their usage is internal, I skipped over the enablement check macros.
The event-raising macros shown in Listing 2 fall into two groups.
- Macros with that begin with
EventWriteERR are intended to report exceptions before control is handed off to the registered Structured Exception handling routine, which usually terminates the process. These events are raised to the Application channel, which is always listening; hence, in the extremely unlikely event of an exception, they record a STOP error in the Application event log. - Macros that have names that begin with
EventWriteEVT raise trace events. Unless something is listening on the DavidAGray-CDeclVsPascal-StopLeak-Debugging custom channel, these events aren't raised, and the code behaves as if they didn't exist.
These function-style macros make short work of instrumenting your code for trace logging that can be a detailed as you want.
Since it is one of the more complex cases, I'll illustrate EventWriteEVT_DataBlockRegistration, which takes the five parameters listed and described in Table 3.
Table 3 lists the 5 parameters required by the EventWriteEVT_DataBlockRegistration function-style macro.| Name | Value |
|---|
plpDataBlock | Void pointer to a data block allocated from some heap |
penmSourceHeapType | Enumerated type that identifies which of five supported heap types |
phHeap | For any process heap, the handle returned by GetProcessHeap() for the default process heap, or by HeapCreate() for a private heap, NULL for all other types |
pfIsProtected | TRUE if the block is protected, and should not be discarded by the next sweep |
ullWhenAdded | 100 nanosecod precise time since last restart when the block was added |
My initial design implemented ullWhenAdded as a FILETIME structure that was set by GetSystemTimeAsFiletime. This changed when something that I was reading about high resolution timers reminded me that the system clock can be reset at any time by the Windows Time service (or another NTP time service that replaces it), and that the adjustment can be up or down. Since either could produce inaccurate results, further study led to substituting the QueryUnbiasedInterruptTime function, which returns a ULONGLONG, a 64-bit unsigned integer that represents the number of ticks, of 100 nanoseconds each, since the last Windows restart. QueryUnbiasedInterruptTime is a high resolution implementation of GetTickCount and GetTickCount64, since there are 107 ticks per second, versus 103 milliseconds. This achieved my ideal, by giving me a value that I could treat as if it were the Ticks member of a BCL System.DateTime structure.
EventWriteEVT_DataBlockRegistration ( ( LONG_PTR ) plpDataBlock ,
                                      penmSourceHeapType ,
                                      ( CDWORD ) phHeap ,
                                      pfIsProtected ,
                                      lpVacantSlot->ullWhenAdded );
Listing 4 is the straightforward call to macro EventWriteEVT_DataBlockRegistration, which appears in function LS_pvt_Register_Heap_Ptr, defined in LS_Memory_Block_Registrars.CPP.
BOOL APIENTRY DllMain
(
HMODULE phModule,
DWORD pul_reason_for_call,
LPVOID plpReserved
)
{
switch ( pul_reason_for_call )
{
case DLL_PROCESS_ATTACH:
if ( m_hProcHeap = GetProcessHeap ( ) )
{ m_hDllModule = phModule;
if ( InitializeCriticalSectionAndSpinCount ( m_lsStackInfo.lpCritSect ,
m_lsStackInfo.dwCritSectSpinCount ) )
{
if ( m_lsStackInfo.lpStackBase = ( LPLS_PTR_STACK_ITEM ) AllocBytes_WW ( LS_INITIAL_STACK_SIZE_DEFAULT * sizeof ( LS_PTR_STACK_ITEM ) ) )
{
if ( m_hThreadSweep = CreateThread ( DW_UNUSED_WW ,
LS_DEFAULT_THREAD_STACK_SIZE ,
SweepStack ,
&m_lsStackInfo ,
LS_START_THREAD_IMMEDIATELY ,
&m_IDSweepertHD ) )
{
return ( !EventRegisterDavidAGray_CDeclVsPascal_StopLeak ( ) );
} else
{
return FALSE ;
} } else
{
return FALSE ;
} } else
{
return FALSE ;
} } else
{ return FALSE ;
} break;
case DLL_THREAD_ATTACH:
case DLL_THREAD_DETACH:
m_dwLastThread = GetCurrentThreadId ( );
break;
case DLL_PROCESS_DETACH:
return ( !EventUnregisterDavidAGray_CDeclVsPascal_StopLeak ( ) ) ;
DEFAULT_UNREACHABLE;
}
UNREFERENCED_PARAMETER ( plpReserved ) ;
return TRUE;
}
Listing 5 is the entire entry point routine, DllMain, of LeakStop32.dll, which is defined in source code module LeakStop32_DllMainain.CPP.
Calling macro EventWriteEVT_DataBlockRegistration, shown in Listing 4, is very straightforward. Although the function-style macro returns a value, I chose to ignore it, since the probability of the failure that it makes known is so low, and the macro resolves to a do-nothing event unless something is actually listening on the debug event channel.
Listing 5 shows the whole DLLMain entry point routine, although jusst two lines matter.
- The last executable statement in the
DLL_PROCESS_ATTACH block calls another macro, EventRegisterDavidAGray_CDeclVsPascal_StopLeak, which registers the event provider with both channels. This function style macro is analogous to the RegisterEventSource Windows API function that registeres a program with an event source in the domain of traditional Windows event logging. - Likewise, the
DLL_PROCESS_DETACH block, which runs when a process detaches from the DLL, calls the inverse macro, EventUnregisterDavidAGray_CDeclVsPascal_StopLeak, analogous to the classic event logging DeregisterEventSource function.
Since both of these functions return ERROR_SUCCESS (zero), which evaluates to FALSE in a Boolean context, to indicate success, and a nonzero system status code, which evaluates to Boolean TRUE, the unary Not operator (!) reverses the logical sense of the return value to match the requirement that a DLL entry point routine return TRUE if it succeeds. This approach is much more concise and efficient than the traditional method of using an IF statement to evaluate the return value and cause the entry point routine to return either True or False. I like to seize such opportunities to compactly return a value from a function, and Boolean functions often lend themselves to such treatment.
Registering the Events and their Channel with Windows
There is one remaining step, which could be incorporated into the build, and that is to register the event manifest with Windows.
wevtutil im C:\Users\DAVE\Documents\Articles_2017\Anatomy_of_a_Stack_Frame\CvsPascal\LeakStop_Message_Strings\LeakStop_EventTraceProvider.man
Listing 6 is the command line that registers the event manifest with Windows. There is no message display to indicate that the function succeeded.
The command shown in Listing 6 registers the manifest, assuming that the solution is installed in directory C:\Users\DAVE\Documents\Articles_2017\Anatomy_of_a_Stack_Frame. Since wevtutil.exe lives in the System32 directory of every Windows installation, which is in the Windows PATH list, this command can be unqualified. Though this command could be implemented in a Post-Build step of either the LeakStop_Message_Strings project, or any other project in the solution, I didn't bother, since it was a one-off event.
Reaching the Summit
Thanks to the Windows Message Analyzer, the final assault on the summit is quick, and almost effortless.
Launch MessageAnalyzer.exe from your desktop shortcut. After a minute or two, the window shown in Figure 12 greets you. Follow the steps described in the captions of Figures 12 through 16 to connfigure your session.
Once your session is configured, press the Start button (lower right corner, Figure 14), then run your program. The result will resemble Figure 1.
You have reached the summit. Commence with your summit ceremony and other activities, and stay as long as you feel like it.
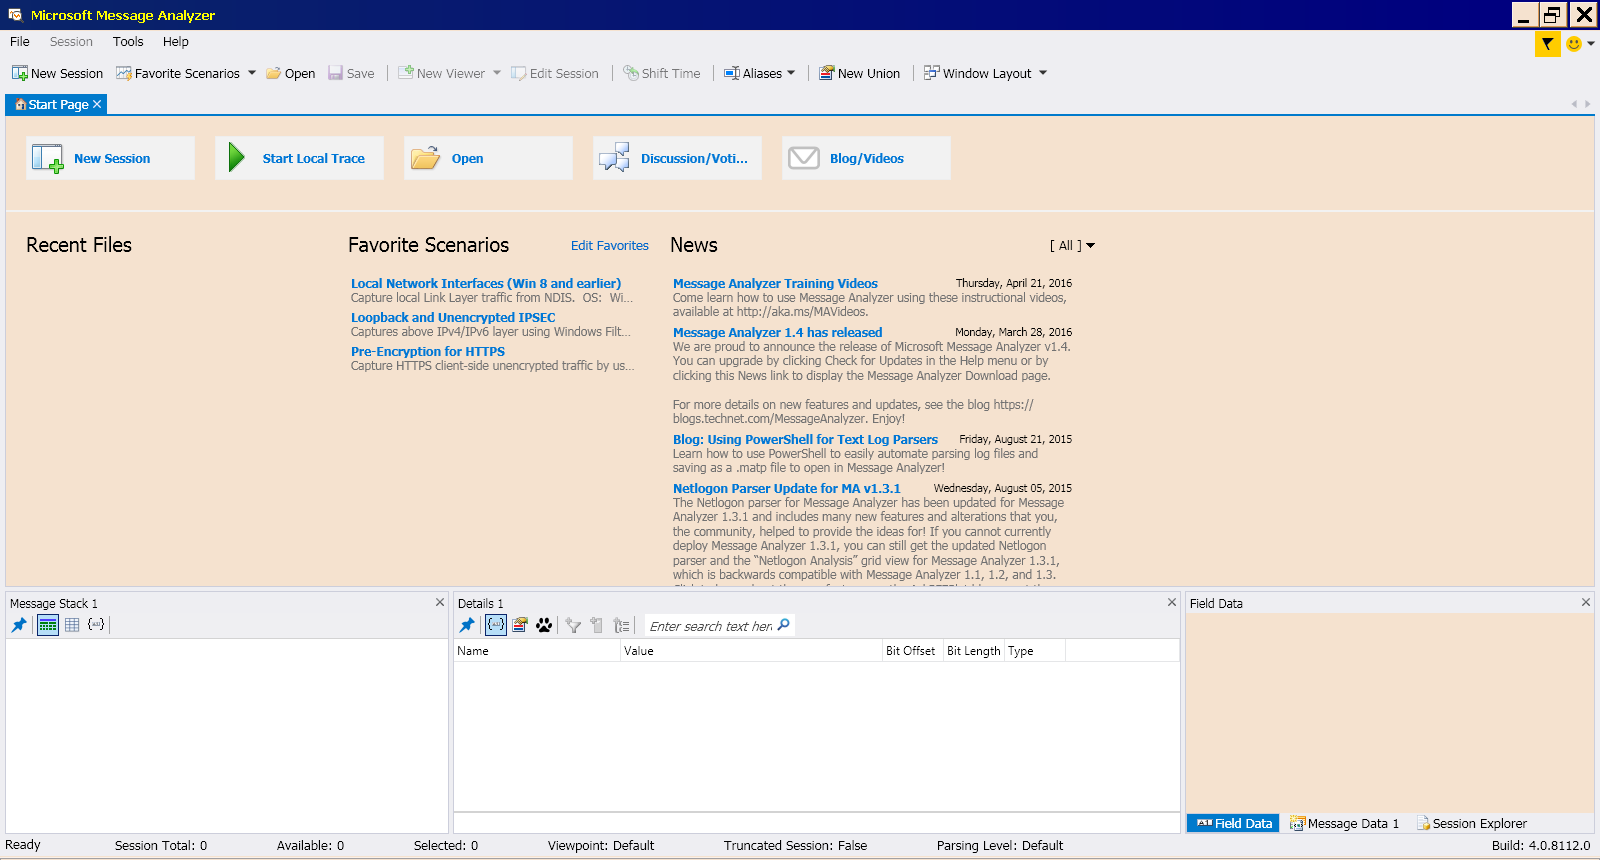 Figure 12 shows the main window displayed by the Microsoft Message Analyzer when it starts.
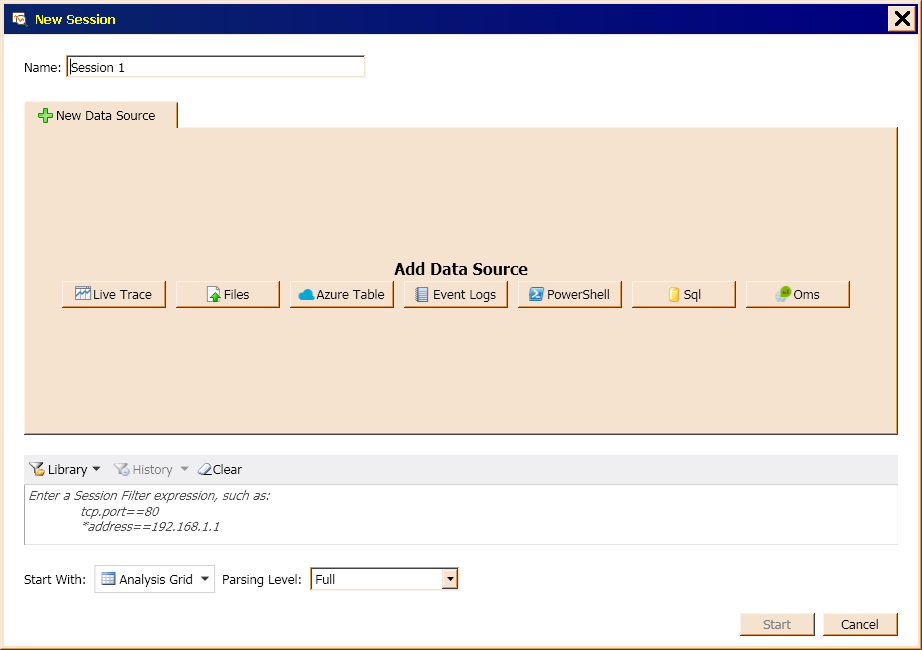 Figure 13 shows the window that appears when you select New Session from the initial screen shown in Figure 12.
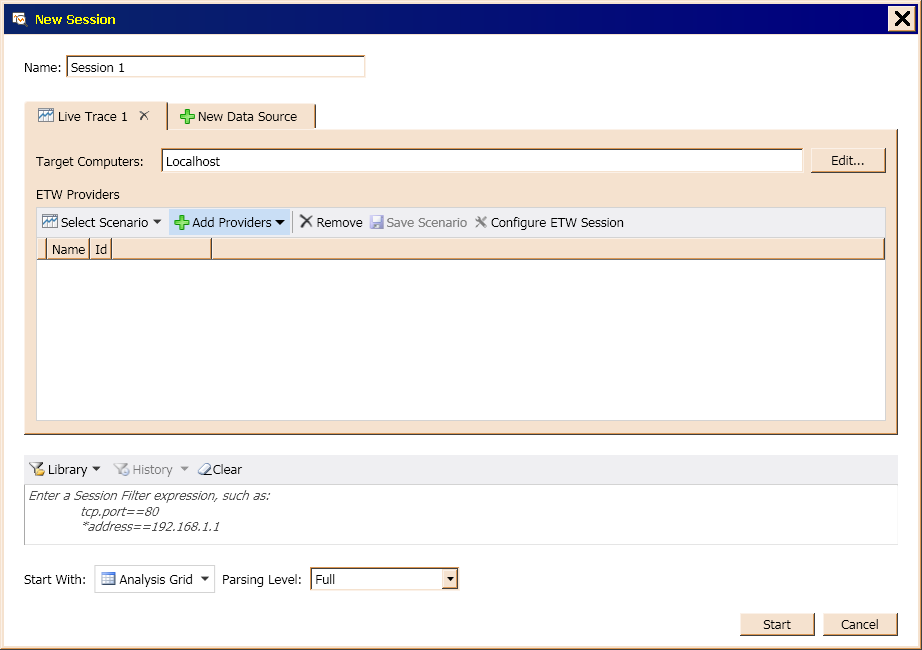 Figure 14 shows the window that displays when you select Live Trace from the form shown in Figure 13, then select the Add Providers feature.
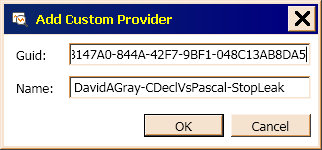
Figure 15 is the Add Custom Provider dialog box, which appears the first time you use your custom provider. You will need the Name and GUID attributes from the Provider element, the third level emement in LeakStop_EventTraceProvider.man.
Points of Interest
I usually have trouble answering the question of whether I did anything "clever or zany," having discovered that behavior that I consider nrmal is often considered by others to be one or both. Nevertheless, following are the points that I think are noteworthy.
- I've already mentioned
return ( !EventRegisterDavidAGray_CDeclVsPascal_StopLeak ( ) ); and return ( !EventUnregisterDavidAGray_CDeclVsPascal_StopLeak ( ) ) ;, both in DLLMain. - Throughout my code, there are many statements of the form
if (m_hProcHeap = GetProcessHeap()), which consilidate saving and testing the value returned by a function. - More clever are statements of the form
if ( InitializeCriticalSectionAndSpinCount ( m_lsStackInfo.lpCritSect , m_lsStackInfo.dwCritSectSpinCount ) ), where the return value is tested in situ, without first copying it from the EAX register into a memory location, which is never agran referenced. Such tests resolve to two very fast machine instructions, a CMP (compare) instruction, followed by one of the conditional jump instructions. - Since it uses direct references to structure members, the code in
DllMain doesn't waste time computing member offset addresses at run time. The same technique could as well be applied to the thread procedure, SweepStack, since both are defined in LeakStop32_DllMainain.CPP. Leaving it as is for this demonstration allows me to call attention to the difference it makes. Since that optimization lies beyond the scope of this article, that investigation is left for interested readers, who can study LeakStop32_DllMainain.asm, in either intermediate output directory of the LeakStop32 project.
I've been told that studying my code is a lot like peeling an onion or a head of cabbage or lettuse. Dig in!
History
Thursday, 08 June 2017 marks the initial release to The Code Project editors.
