Introduction
One of the most common types of reports is a master detail report. The following tutorial provides the most straightforward method for creating this type of a report in Visual Studio 2005. We will be using the Access NorthWind database as our data source. If you do not have the NorthWind database, you can download it here.
Note: SQL Server 2005 Reporting Services (.rdl) uses a similar method for creating master detail groupings.
1. Add a new report to the project
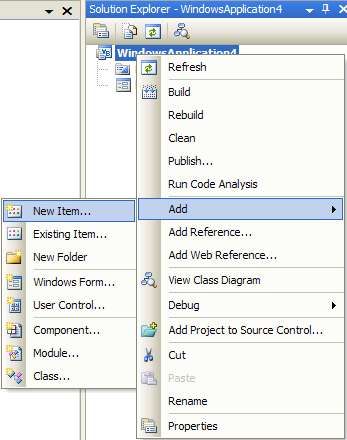
- Right click the project in Solution Explorer.
- Select Add/New Item.

- Select Report:

- Name the report, and click Add.
2. Create the DataSource and TableAdapter for the report
- Open the Data Sources window.

- Click the Add New Data Source button (top left).
- Select Database.
- Select New Connection...
- Change the DataSource to Microsoft Access Database File.
- Select the NorthWind database: C:\Program Files\Microsoft Office\Office\Samples\Northwind.mdb.
- Test Connection, and click OK when successful.
- Click Next.
- Click Next ("Save the connection string to the application configuration file").
- Choose Views, then check the "Sales by Category" view. Note: When doing this for real, you will need to create a flat view in your data source that provides data with the top level information repeated on each line. This sample view has been created in this manner.
Example:
SELECT * FROM Main JOIN Detail ON Main.MainID = Detail.MainID
"Main Info, Detail1"
"Main Info, Detail2"
"Main Info, Detail3"
- Click Finish. The
NorthWindDataSet should now appear in your Data Sources window.

There are three main ways to create a hierarchical report using grouping. This example will use the "Master List Detail Table" method. The other two methods are "Master List Detail List" and "Single Table Master Detail". An alternate method to using groups is to use sub-reports.
3. Add the master list
- Open your Toolbox.
- In the Report Items section, drag a list onto your report. (This will be the master list.)

- Open the Data Sources Window.
- Drag the
CategoryID and CategoryName fields into the list (Master section).
- Right click the list, and select Properties.
- Click "Edit Details Group".
- In the "Group on" section, select the master record's ID field,
CategoryID in this case.
- Optional: In the document map label field, select the master record's description field,
CategoryName in this case. This will provide a clickable tree in the report viewer to switch between master records.
- Optional: Click page break at the end. This will put page breaks between each master record.

4. Add the detail table
- Drag a table from the Report Items toolbox section into your master list.

- Right-click the top left corner of the table, and select Properties.
- Set the DataSet name to the NorthwindDataSet_Sales_by_Category table. Some clarification: the report designer refers to a result set as a "DataSet". This is not the same as a .NET Framework "
DataSet". The report designer's "DataSet" more closely relates to a .NET DataTable.
- Select the Groups tab.
- Click Details Grouping... Note: In a single table master detail report, you would instead click "Add...".
- Group on each detail column. In this case:
ProductName and ProductSales.

- Click OK.
- Click OK.
- Drop the
ProductName field into the Detail (middle) row of the first column in the table.
- Drop the
ProductSales field into the Detail (middle) row of the second column in the table.

- Optional: Resize the parent list textboxes, bold the table's column headers, and add another textbox label for the ID.
- Optional: Drag the Product Sales column from the Data Sources into the Detail table's Product Sales Footer row.
Note: VS automatically inserts the Sum aggregate function which will provide a subtotal of the Products within the Parent category.
- Optional: Prepend some descriptive text ("Total: " in this case) into the summary Footer record, and format the Detail and Footer values as currency.
Detail:  = FormatCurrency(Fields!ProductSales.Value)
Footer:  = "Total: " & FormatCurrency(Sum(Fields!ProductSales.Value))

5. Create the report form
- Open
Form1 from Solution Explorer.
- Drop a
ReportViewer onto the form (from the data section of the Toolbox). A dialog should appear. If this dialog disappears, use the triangle button on the top right border of the ReportViewer to see it again.
- Select the report from the Choose Report combo.
- Click Dock in the parent container to fill it to the form. Note: This adds the
DataSet, TableAdapter, data source, and adapter code to fill the adapter.

Run the project.

With optional formatting:

Advanced
1. Filter the results (WHERE clause)
- Right-click the
DataSet in Solution Explorer and select View Designer.

- Right-click the TableAdapter section of the
DataTable, and select Configure....

- Modify the SQL statement to include the
WHERE clause. For SQL Server, you would use a named parameter @CategoryId. OLEDB adapters require ? parameters.

- Click Finish.
- Add the appropriate controls for your form to provide the parameter value.
- Move the code to fill the adapter, and refresh the report from the Form
Load event to the event that will load the report. For example: "Go" button Click event.
- Provide the required parameter in the adapter's
Fill method.

Conclusion
Please comment on anything that needs further clarification, or with any questions on implementing this. Also, please provide suggestions before rating the article less than a 5.
