Introduction
Task manager is quite invaluable when it comes to system programming. Rogue thread appeared here, and process ID needed there… All this and even more can be tracked using the task manager with ease. What the task manager severely lacked (in my opinion) was an ability to fetch more specific info about the processes like the IDs of all the threads, handles to DLLs, ability to suspend specific threads of a specific process and, finally, an ability to view the process’ virtual memory.
The project was originally started as part of my diploma work and, after receiving yay-we-lacked-that's from my teachers, I decided to share it with more people.
The program still lacks some planned features (like an ability to attach hooks to the processes), which I am planning to add in future.
Overview
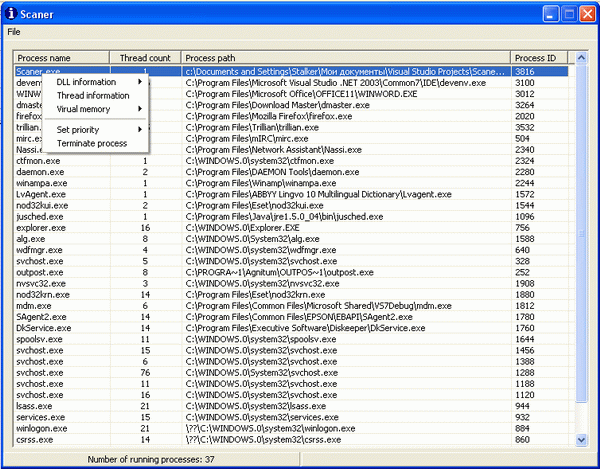
When you start a program you are shown the main window which shows all the currently running processes in your system, the number of threads per process and the executable path. The status bar will show you the overall number of running processes. The list will be updated every 5 seconds (by default) but you can change that in the main menu. Pressing Enter will force the update of the list.
From the main menu you can force update the process list and enter Options where you can customize the refresh time, turn hot track on\off (on by default) and customize the colors of the memory regions in the virtual memory map (more on this later).
Right-clicking on any of these processes (except System Idle) will bring up the context menu which will uncover all the features of the program. Here you can get information about the process’ threads, DLLs, virtual memory, set process’ priority or kill it all together.
DLL info
Here you can either view the general information (path, handle, size, base address) or disassembly the information (Note: Requires DUMPBIN.EXE, LINK.EXE, MSDIS110.DLL, MSPDB60.DLL and mspdb71.dll to be in the program directory).
Thread info
This dialog will show you a list of thread IDs (primary thread is the top one) and will grant you the ability to terminate, suspend, resume or set thread priority. Also it will show you the ID of the owning process and suspend the count.
Set priority and terminate process
These work similar to the task manager ones. Note that messing with system processes can result in something nasty.
Virtual memory
This submenu reveals the core of the whole program. From here you can either dump virtual memory or draw a memory map.
Dumping virtual memory
Selecting this menu option will bring up another dialog, containing text information about all the memory regions. Pressing Enter will refresh the list, double-clicking will bring up the dialog showing the content of the specific memory region.
Drawing the map of virtual memory
This menu option will bring up the dialog with the map of the process’ virtual memory. While it is similar to the functionality of memory dumping it provides a more visual view on your (or not) virtual memory. From the menu you can either refresh the map or select two options of drawing the map, either by state (free, committed, reserved) or by type (image, private, mapped).
Every sector corresponds to one memory region. The color will vary depending on the state or type and can be changed in the main window menu.
Single clicking on the region will bring up the Tooltip providing the information that you’ve seen in the memory dump dialog. That information will also be copied to your clipboard. Clicking on the free area will bring up the Tooltip with the overall number of regions (info will also be copied to your clipboard). Double-clicking on the region will bring up the dialog showing its content just like with the memory dump dialog.
If the map won’t fit the screen – simply resize it. Automatic resizing and region scaling were not implemented due to some odd and crazy bugs I encountered.
This covers all the functions of the featured program. Note that administrative access is preferred because then you will get more control over the processes (obviously). The program was not tested on normal user accounts so I am not aware of any possible bugs when using it.
Other resources used
Additional notes
The project was developed using Visual Studio .NET 2003 and is not compatible with previous versions of VS (this doesn't apply to the overall program functionality, but to the ability to compile the code).
