Introduction
The visualization of data by charts is a way to make a phenomenon more understandable, provided that we choose an appropriate chart and, for some type, we don't aspect a precise correspondence.
A chart can have one or more set of numeric data that can be viewed as one coordinate being the other an implicit progressive number corresponding to an enumeration or a temporal instants.
Some charts can accept multiple sets of data that can be drawn together if these have a compatible scale. Two non-homogeneous sets can be arranged in point chart where the point generated by the first set becomes a bubble which dimensions is proportional to the corresponding data on the second set.
If we have a set of partitioned data or, it is the same thing, a set of percentage the best display can be a Pie or a Ring Chart.
This brief examination does not exhaust, of course, all the possible charts or variations that you can find in the attached documentation, however it is sufficient to illustrate the program developed.
The table below is a summary.
| Type of Chart | Type of data |
| Area | Set or sets with same scale | Values from linear phenomena |
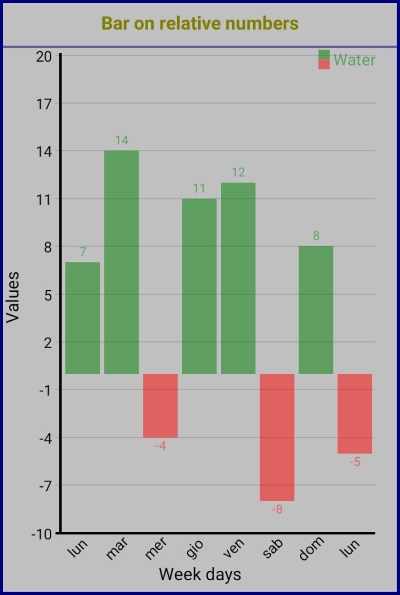
| Bar | Set or sets with same scale | Temporal or enumeration data |
| Bubble | Sets whit different scale | Bubble instead of point proportional to second set |
| Line | Set or sets with same scale | Values from phenomena usually taken at fixed point |
| Delta | Couple of set of same scale | Difference from two set |
| Pie, Ring | Partition of set | A possible second set creates variable slices |
| Point | Set or sets with same scale | Values from phenomena usually taken at fixed point |
| Venn | two sets and their intersection |
Using the Program
The program is a "sand box" that permits to try the script Chart.bas using my Form Generator for B4A which is used to enter the data necessary for the generation of the Chart. Chart.bas is an activity module, it contains two functions that have one parameter, i.e., a string describing the chart.
CallSubDelayed2(Charts,"startChart",param)
CallSubDelayed2(Charts,"changeOrientation",param)
How the Program Works
The creation of a chart is based on a description where the objects that compose it are followed by their properties with the possibly value(s); if a properties has multiple values, for example, a list of colors or labels, these must be enclosed in apostrophes. The order of objects is not important; however, in case of multiple type of charts, some properties are taken from the first chart. The chart description is parsed using Regular Expression (see paragraph Example of use of Regular expression for an explanation of machinery), after the parsing the chart is generated using the B4A object canvas.
The algorithms to generate Charts do not have any particular difficulty, except for the creation of the pie slices and the representation of a Venn diagram. You can find the mathematics involved in the Technical reference chapter of documentation attached.
The Pie Slice
In the version of B4A used for developing this program, it is not possible to draw arcs but only circles, then a slice can be obtained clipping an appropriate area, draw a circle and remove the clipping area.
In the figure on the right, the dotted lines enclose the clipping area for obtaining a slice. The clipping area needs point expressed in Cartesian coordinates, this means for point B to calculate the intersection of circle and the straight line of equation y = tan(θ)*x and the point A is the intersection of the lines:
- y = tan(α+θ)*x
- y = (-1/ tan(θ))*x
Instead with polar coordinates, the task is much easier indeed the coordinates of the three points are:
- C(0, 0)
- B(R, θ)
- A(R*SQRT(1+tan(α)* tan(α))), θ+α) (the length of AB is R*tan(α) and for Pythagoras Theorem CA2 = R2 + R*tan(α)2)
which can be easily converted into Cartesian coordinates by the relations: x = ρ * cos(φ) and y = ρ * sin(φ).
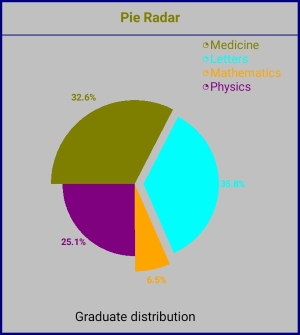
 | In the image on the left, an example of Pie Radar with one slice exploded. The script that generated the chart is: Chart Pie color 'Silver' Border labels 'Medicine Letters Mathematics Physics' Data 'Graduate distribution' '100 110 20 77,6.8 4.1 7.9 3.1' Color 'Olive aqua orange purple' Title 'Pie Radar' color Olive Align CENTER explode '2' show '%' .
Sub drawSlice(Canvas As Canvas, center() As Int, _
Radius As Int, startDegree As Float, _
sliceAngle As Float, Color As Int, explode As Int)
Dim cx As Int = center(0)
Dim cy As Int = center(1)
cx = cx + explode * CosD(startDegree+0.5*sliceAngle)
cy = cy + explode * SinD(startDegree+0.5*sliceAngle)
Dim p As Path
Do While sliceAngle > 0
Dim slDg As Float = 72
If slDg > sliceAngle Then slDg = sliceAngle
p.Initialize(cx, cy)
p.LineTo(cx+Radius*CosD_
(startDegree),cy+Radius*SinD(startDegree))
Dim ip As Float = Radius*Sqrt_
(1+TanD(slDg)*TanD(slDg))
p.LineTo(cx+ip*CosD(slDg+startDegree),_
cy+ip*SinD(slDg+startDegree))
p.lineTo(cx, cy)
Canvas.ClipPath(p)
Canvas.DrawCircle_
(cx, cy, Radius, Color, True, 0)
Canvas.RemoveClip
sliceAngle = sliceAngle - slDg
startDegree = startDegree + slDg
Loop
End Sub
|
The Venn Diagram
The Venn Diagrams can be viewed as an analogical correspondence from number to graphic representation, like a pie chart where sectors are proportional to the relative percentage.
In the Venn diagrams, therefore, this proportionality is only in the case of two sets and their intersection; for three sets, the correspondence can be only for all sets and their intersection two by two and not for their triple intersection. In some cases, the above proportionality isn't possible.
In the fragment below, the intersection area is used for finding the distance of the two centres and this is accomplished by the bisection method:
...
Dim intersectArea As Float = itemdata(0).data(2)
Dim x1 As Float = r1+r2
Dim x2 As Float = 0
Do While Abs(intersectArea - a(0)) > 0.001
Log(intersectArea - a(0))
Dim d As Float = 0.5*(x1+x2)
a = areaOfIntersection(r1,d, r2)
If a(0) < intersectArea Then x1 = d
If a(0) >= intersectArea Then x2 = d
Loop
...
private Sub areaOfIntersection(r1 As Float, d As Float, r2 As Float) As Float()
Dim rr1 As Float = r1 * r1
Dim rr2 As Float = r2 * r2
Dim d2 As Float = d * d
Dim phi As Float = 2 * (ACos((rr1 + d2 - rr2) / (2 * r1 * d)))
Dim theta As Float = 2 * (ACos((rr2 + d2 - rr1) / (2 * r2 * d)))
Dim a(2) As Float
a(0) = 0.5 * (rr1 * (theta - Sin(theta)) + rr2 * (phi - Sin(phi)))
a(1) = r1 * Cos(phi * 0.5)
Return a
End Sub
Example of Use of Regular Expression
In the site https://regex101.com/, you can try your regular expression.
B4A has the object Matcher whose Match property contains the string of characters that matched the search.
Parse a List of Colors
Color can be one of symbolic name, those of the object Colors plus some others, possibly followed by a transparency value or a hexadecimal value, moreover the color can be repeated, for example the colors of pie slices: color 'red 127 green x7f00007f' i.e. transparent red, green and transparent dark blue.
The Regular Expression is: ([xX][0-9a-fA-F]{1,8})|([a-zA-Z]+\s+\d{1,3})|([a-zA-Z]+); the symbol | separate alternative occurrences of color and (...) allows to memorize the value found:
([xX][0-9a-fA-F]{1,8}) - this captures a hexadecimal value, maximum 8 digits, provided it is prefixed by x([a-zA-Z]+\s+\d{1,3}) - this captures a word followed by a number of maximum three digits([a-zA-Z]+) - this captures a word
Note that the order is important for capturing the different color coding and after the extraction, the values must be validated. Here above a function for extracts the (possibly) values.
Public Sub splitColors(c As String) As List
Dim Match As Matcher = Regex.Matcher(reSplitColors,c)
Dim l1 As List
l1.initialize
Do While Match.Find
l1.Add(interpColor(Match.Match))
Loop
Return l1
End Sub
The resulting of matching the string c by the regular expression reSplitColors is a list that contains all colors matched.
Parse a List of Labels
Labels can be separated by space(s), in case of label with spaces the separator is comma; so the Regular Expression is \s*([^,]+)\s*,|([^\s,]+).
This case is treated a little different from the previous because the recognizing pattern can contain a delimiter which must not be extracted. The string extracted, that is what is enclosed in parenthesis is in the property Group(n) where n is the n-th alternative of the Regular Expression.
...
Dim reSplitTokens As String = "\s*([^,]+)\s*,|([^\s,]+)"
...
itemData.labels = getItems(replace(getItem("labels","")),reSplitTokens)
...
Sub getItems(s As String, re As String) As String()
Dim list As List
list.Initialize
Dim Mtch As Matcher
Mtch = Regex.Matcher2(re,Regex.CASE_INSENSITIVE,s)
Do While Mtch.Find
For i=1 To Mtch.GroupCount
If Mtch.Group(i) <> Null Then list.Add(removeDelimiters(Mtch.Group(i)))
Next
Loop
Return list2Array(list)
End Sub
Notes
JavaScript and B4A Canvas
JavaScript canvas is an object rich of methods where the core is the transformation matrix[1].
Writing this software, I fight with the limits of B4A canvas, that is:
- there aren't primitive for draw circle sectors[2]
- the clip area is only polygonal[2]
- lines are only continuous
- there is nothing native for smoothing lines
Caveats
The program is still in its initial phase, in addition to obvious and easy implementation, not all data is perfectly controlled so use it with caution (at your own risk) and criticize it harshly. Obviously, suggestions are welcome.
Finally, the program does not offer you advertising or read your personal data.
- ^See Chapter of JavaScript course.
- ^In recent version of B4A a clip area can be set to a sector.
