Introduction
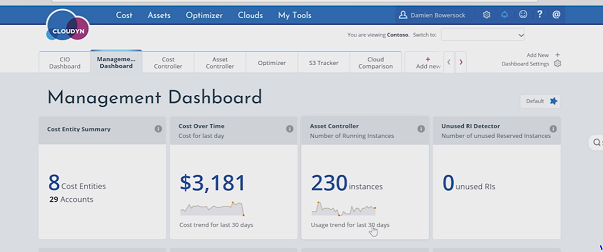
Cloudyn is a Microsoft subsidiary. It has similar functions to Azure Cost Management (ACM). Cloudyn uses dashboard reports to help with usage monitoring, spending and cost allocation for Azure, as well as Amazon Web Services, Google and other cloud service providers. Dashboards, essentially a collection of widgets, provide a high level view of reports and these dashboards can be easily customised to the needs of your organisation.

Why Is It Important to Monitor Usage and Spending?
It’s important because an organisation pays for the cloud resources it consumes over time. The Cloudyn dashboard reports show cost allocation, as well as identify underutilised cloud resources, which you can then adjust in order to use your resources more effectively. For example, you can identify and remove idle virtual machines (VM) and unattached disks to improve efficiency. It’s important to monitor usage as once usage is greater than that set out in agreement thresholds, costs can increase very rapidly.
But Why Does Monitoring Have to Be Automated?
It doesn’t have to be; however, there are a number of factors which make ad hoc monitoring challenging. First, when costs are estimated based on average usage, it works on the assumption that usage is consistent over a billing period, but this is frequently not the case. However, using Cloudyn’s reports enables you to monitor usage, costs and trends and if you use over time reports you can easily detect any deviations from the normal level of usage. Also, once trends have been identified, they can be used to more accurately predict future costs. Furthermore, once costs are reaching or threatening to exceed your set budget, then it’s important to get notifications warning you of this. Notifications can help you to adjust your spending and avoid a possibly rapid increase in costs. You can also be alerted if unusual spending occurs.
Using Cloudyn to Manage Costs

First, historical data can be used to predict future usage and costs using Cloudyn’s projected cost reports. Also, you can tag your entities, accounts and resources in order to refine your cost allocation. Subscriptions can be allocated to different cost entities and then an Actual Cost Analysis takes all of your spending and aggregates it over a period of time. Cost Manager can in this way be used to provide additional information about where and on what your money is being spent.

The information contained in Sizing Optimization and Inefficiency reports can be used to make your data usage more efficient and thus, reduce costs.
Different Types of Cloudyn Reports
There are three main types of Cloudyn reports: Over Time reports, Analysis reports and Tabular reports.
- Over Time reports show a time series of data over a selected interval. You can use grouping and filtering to look at specific points of interest in more detail. Over Time reports are useful for looking at overall trends, as well as anomalies and spikes.
- Analysis reports show aggregated data over a period of time. They also allow grouping and filtering and can be used to show the underlying causes of anomalies.
- All reports can be viewed as a table, but some reports can only be viewed in tabular form. For example, recommendations are a tabular report.
You can schedule any report to be delivered periodically. Furthermore, Cost reports include setting a threshold so they can be used for alerts.
Reports and Reporting Features
The Cost analysis report calculates your showback and chargeback, based on your policy. You choose a time frame and the Cost Analysis report aggregates your cloud consumption during that time period, after having applied all allocation rules to your cost. It can also be used to view costs by tag categories.
The Cost over Time report displays the results of cost allocation as time series. Using this report will allow you to identify trends and any spikes or irregularities in your deployment and help you to understand why there was a cost increase for a specific instance.
The Actual Cost Over Time report distributes cost over a specified period of time and it allows you to observe trends and identify spikes or anomalies. It also allows filtering and grouping. For example, the image below shows filtered services on an Actual Cost Over Time report.

The Current Month Projected Cost report shows your costs from the beginning of the month, from the previous month and the total projected cost for the current month. The sum of the up-to-date monthly coast and a forecast based on the cost monitored in the previous 30 days is used to calculate the current month projected cost. It can be used to project monthly costs by service or by account.

The Annual Projected Cost report enables you to look at projected costs for a year, based on previous spending trends. The projection is made using a trend function which is extrapolated for the next 12 months based on the costs in the previous 30 days.
Optimizer reports can be used to improve efficiency by optimizing usage and also to reduce the cost of your cloud resources. A common problem for organisations is their virtualization strategy. When organisations first move their resources to the cloud, they often use a similar approach as they did when they created virtual machines (VM) for the on-premises virtualization. However, this can be a costly approach as moving large or idle VMs to the cloud will most likely increase costs. Optimizer reports are very useful in identifying these large, idle or under-utilised VMs.
The Cost Effective Sizing Recommendations report will identify the possible annual savings by comparing VM instance type capacity to their historical CPU and memory usage data.

Finally, you can export data from any report or you can schedule any report to get sent out as an email.
History
- 25th October, 2018: Version 1
