Introduction
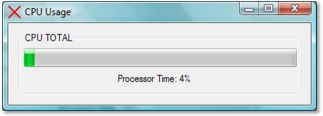
This article describes a quick and simple approach to displaying information about the state of the CPU or CPUs on a targeted machine; the example provided shows how to display the percentage of processor time consumed by the CPU or CPUs on the target machine. This is accomplished by configuring a performance counter and periodically polling for and displaying the percent processor time value using a standard ProgressBar and Label control. This example is representative of only a small portion of the items that may be monitored or captured using the performance counter. The performance counter may also be used to capture a variety of information ranging from the state of the current CLR to the state of the print queue.

Figure 1. Displaying CPU Processor Time
The example shown herein could also be used to monitor the state of multiple processors on a single machine; this could be accomplished merely by getting the CPU count (System.Environment.ProcessorCount returns this value) and dynamically adding and populating the Performance Monitor controls at runtime, assigning each to monitor a separate CPU.
Whilst not included in this demo, using the same approach indicated in the last paragraph along with the Dundas .NET Gauge Control, I have set up a form that displays the percent of processor time on a machine equipped with an Intel Centrino Duo dual core processor; a screen shot of this form in use follows:

Figure 2. Monitoring Each Processor in a Dual Core System
Getting Started
In order to get started, start up the Visual Studio 2005 IDE and open the included project. The solution consists of a WinForms project with a single form included. The form is used to display the total CPU information.
The solution does not use any additional references aside from the defaults.
Figure 3 shows the Solution Explorer for this project:

Figure 3. Solution Explorer
The Code: Main Form
The main form of the application is populated with the following standard toolbox controls:
- A
GroupBox control
- A
Label control
- A
ProgressBar control
- A
PerformanceCounter control
- A
Timer control
The GroupBox control is used to contain the other controls. The ProgressBar control is set to display a value between 0 and 100, and its Step property is set to 1. The Label control will be used to display the current numeric value of the progress bar; the progress bar will display the processor time percentage as captured from the PerformanceCounter control. Both the ProgressBar and the Label control will be updated in response to the Timer control’s Tick event handler. The Timer control is set to evoke the Tick event handler every 10000 msec, and it is enabled from initialization.
The properties for the PerformanceCounter control are set to capture the processor time percentage, and may be set in code or in the IDE’s property grid; in this example, the values were set in the grid:

Figure 4 4. Performance Counter Control Properties
To configure the control for the purposes of this example, the CategoryName property was set to “Processor”, the CounterName property was set to “% Processor Time”, and the InstanceName was set to “_Total”. To monitor the state of a single process, the InstanceName property would be set to point to a specific processor (e.g., 0 or 1). You may wish to examine some of the other CategoryNames and CounterNames available in the drop downs to get a feel for some of the many other things you can examine through this control.
With these properties set, there is little else to do other than write a couple of lines of code; the following is the sum total of all of the code in the main form of the application:
using System;
using System.Collections.Generic;
using System.ComponentModel;
using System.Data;
using System.Drawing;
using System.Text;
using System.Windows.Forms;

namespace CpuUsageTest
{
    public partial class frmCpuUsage : Form
    {
        public frmCpuUsage()
        {
            InitializeComponent();
        }

        private void Form1_Load(object sender, EventArgs e)
        {

        }

        private void timer1_Tick(object sender, EventArgs e)
        {
            progressBar1.Value = (int)(performanceCounter1.NextValue());
            label1.Text = "Processor Time: " +
                          progressBar1.Value.ToString() + "%";
        }
    }
}
As you can see, the only real addition to the default code is the handler for the timer Tick event; in the two lines of code added, the progress bar value is set to display the value from the performance counter. The Label control is updated with the value passed to the progress bar. These values are updated each time the Tick event is fired.
Summary
This article described an approach to monitoring the percent of processor time associated with all of the processors on a targeted machine; this could be modified with little difficulty to display the values associated with each of the processors on a multi-processor machine. Aside from the example shown herein, the PerformanceCounter control may be deployed to monitor or capture a large variety of information about the system as well as of the processors.
