Introduction
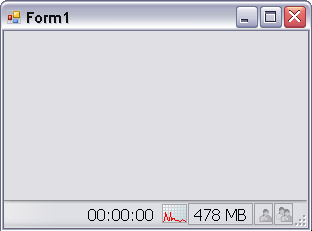
This is a very easy class that should make the developer's life a little bit more comfortable, nothing more, nothing less. It displays a mini chart in the StatusStrip that reflects the changes of a PerformanceCounter instance. You can use it as a simple chart, as a chart with text, or as a text only item. No matter how many items you use in your application, they are all triggered by a single System.Timer.Timer instance to avoid memory and resource wasting. Have fun with it.
Warning
As the posting from Patrick Sears picks up, the PerformanceCounter uses language-specific values for the CategoryName, CounterName, and InstanceName properties. If you do not use an English or a German system, it's necessary to reset these values on your system after opening the demo project; otherwise, the program will throw an exception.
Background
While developing an application that loads a lot of images via the TWAIN interface and sending them to an SQL Server, I found that I frequently had to open the Task Manager to see what happens with the CPU and the memory. Lazy as I am, I decided one day that there should be a possibility to see these values in the StatusStrip instead of using a second window. So, I searched the web (preferentially, the CodeProject pages!) to find out how to realize this. The first thing I found was that I had to use the PerformanceCounter class, which was very easy to manage. Then, I saw that there were a lot of solutions, but none that covers my needs to have a very simple to use status strip item... So, guess what I did...
Using the PerformanceCounterItem Control
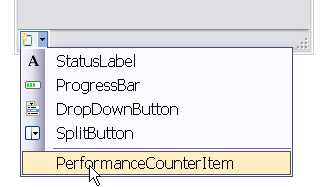
Using the ToolStripStatusPerformanceCounterItem is very simple. If the class is part of your project as in the example, or if an external DLL containing it has been linked, simply add an instance to your StatusStrip:

Then, add a PerformanceCounter to your form, and configure its CategoryName, CounterName, and InstanceName properties with the desired values, and set the item's PerformanceCounter property to this instance. That's it. (The example uses one item to display the processor time and another for the committed memory.) The item will behave exactly like every other ToolStripStatusLabel, with the Image property set to any image, so that you can use any of its well known properties, as e.g., the TextImageRelation property to decide where the image and text will appear. To customize the chart, there is the ChartStyle property where you can choose some colors to adapt the control to your needs. The Caption property enables you to display the value as a text. It uses the same pattern like the String.Format method, so that you will recognize it easily. E.g., the code:
...
this.performanceCounterItem1.Caption = "{0:0} %"
...
will display the CPU usage as a number without decimals, followed by the '%' symbol. With the Maximum and Minimum properties, you can adjust the maximum and minimum value that will be displayed in the chart. Setting the ChartStyle.AutoSizeText property to a string that will occupy the maximum length of the possible values, you can prevent the item's size from changing with every changing of its value. That is surely not the best way to solve this problem, but I hope there is a keen programmer who will show me a smarter solution.
If you need another instance of the item, e.g., displaying the memory usage as in the example, then add a PerformanceCounter instance to your Form, apply the desired settings for the CategoryName, the CounterName, and the InstanceName, and then set the new PerformanceCounterStatusItem's PerformanceCounter property to this instance.
Points of Interest
As you can see, there is nothing really special in the code. The only interesting thing about it is that the code uses one single timer to trigger every item. As it is a System.Timer.Timer instance, we have to use an instance of a AsyncOperation to call the event handler on the appropriate thread.
#region timer_Elapsed(object sender, ElapsedEventArgs e)
static void timer_Elapsed(object sender, System.Timers.ElapsedEventArgs e)
{
foreach (ToolStripPerformanceCounterItem item in instances)
{
if(item.PerformanceCounter != null)
item.asyncOperation.Post(item.timerAsyncCallBack,
values[item.PerformanceCounter]);
}
}
#endregion
History
That's the very first version of this control. I'm not sure if it is worth enhancing it, because it fits every need I have at the moment.
There are some evident deficiencies that could be eliminated, but I will surely not have enough time to do so:
- If a
PerformanceCounter is used whose maximum value isn't fixed, there is no way yet to display it as a chart. - The
Minimum property isn't implemented yet. - The image doesn't fit if you use the
BorderSides property. That's not really necessary, but it would look better. - There is no
ToolBoxBitmap, but honestly, I don't know how to add this so that the drop down box of the StatusStrip displays it. - The
AutoSizeText property is a makeshift, because I haven't found any format string that reserves the space for a string without displaying digits. - ... surely there are some more necessities that are not fulfilled ...

