Introduction
Microsoft released Silverlight 5 Beta yesterday during MIX11 conference. It has a great new features set. Among them, the most demanded feature was Debugging Data Bindings in XAML. In this article, I will step you through the complete debugging feature in Visual Studio for Silverlight 5 XAML page.
Read the complete article to know more about it and gather knowledge on the debugging feature with a simple code walkthrough. At the end, don't hesitate to leave your feedback. Queries are welcome. I will try to answer you as much as I can.
Prerequisite
Before starting with the rest of the topic, you need to set up your development environment. You need Visual Studio 2010 with SP1, Silverlight 5 Beta Tools for Visual Studio 2010. Later, you need to create a new Silverlight project.
Find the below posts, which will answer all your queries and help you to set up your prerequisite:
- Install Silverlight 5 Beta in your development environment. You can install it side-by-side with the existing Silverlight versions.
- New to Silverlight 5? This post will help you to Create your first Silverlight 5 project.
Once your dev environment is set up properly, jump to the next step to start discussing on the main topic. Don't forget to ask your queries at the end of the articles.
Creating a Simple UI
We need to create our application UI first. Make it simple enough with just a single TextBlock. Assign a string to its Text property (as shown below):

Now as we can debug the XAML, we can put a breakpoint too, right? Try to put a breakpoint in the Grid level.  Not working!!! Hmm, we can debug data only, not a Grid or a panel. So, try to put the breakpoint on the TextBlock.
  Ahh, that is also not working!!! So, what the hell is this feature?
Don't worry. Silverlight 5 features "Debugging Data Bindings in XAML". The article title also says that. We hard coded the text value of the TextBlock. Hence, there is no data binding there. How can we think that this will work? Ohh!!! Intelligent IDE. 
Data Binding to the Control and Setting Breakpoint
Let's modify the Text property and set a binding there. We will bind "Message" to the Text property. Now try to put a breakpoint here. Cool, it inserted the breakpoint for the TextBlock control.
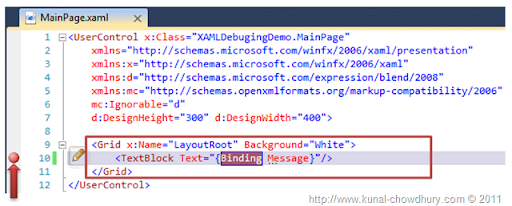
Have a look into the above screenshot. There you will see how we created the binding and set the breakpoint for the binding. This will show error as we didn't set the DataContext there. Every binding needs a DataContext to refer to the respective property.
We will create a simple Dependency Property in the Main Page XAML file. Hence, we will add a x:Name to the UserControl. Now we will set the ElementName to the binding. Have a look at the following screenshot:
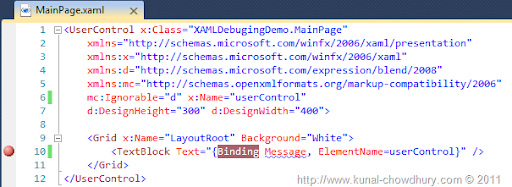
If we used MVVM, we need to create the ViewModel instance in the view and then we need to set the DataContext as the static resource to the ViewModel. Once this part is done, your binding will work properly.
Now we need to create the Dependency Property called "Message" in the MainPage.xaml.cs file. We will create a string property. Here is the code for that:
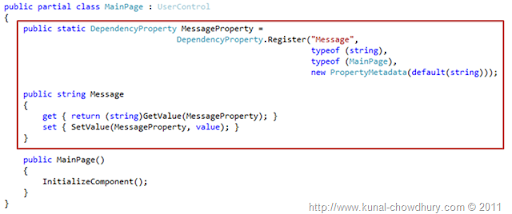
Once you are done with this part, we are ready with our code implementation. Now it's time for us to see the demo in action.
Debugging Data Bindings
Let's build and run our sample application. Generally, it should not give any build error, if you properly followed the steps mentioned above. If you get any errors, fix them. Once you run the application, you will see that the XAML breakpoint got hit and the application stopped in the break point.
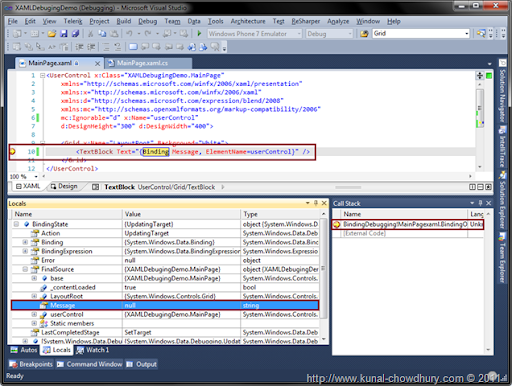
If you open the "Locals" panel and/or the "Call Stack" panel, you will notice the complete stack of the data and origin there.
Just expand the Binding State and then Final Source. You will see the Dependency Property there, which we binded to the TextBlock. The value of the property will say "null" because we didn't set any value for it.
Open your code behind file now and set a value to the properties on page load or in the constructor. Now run the application once again. It will again hit the breakpoint and if you expand the Binding State in the local panel, you will notice that the value has been assigned to the property this time. If you get any binding error, you can find it in the Error property inside the BindingState.
Here is the screenshot which will give you a better idea about it:
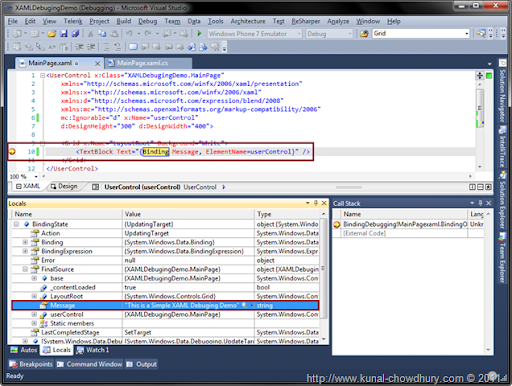
You will be also able to find and set any value of any UI control at the time of XAML debugging.
Difference Between OneWay and TwoWay Debugging
In our example, we have a TextBlock. TextBlock always uses OneWay data binding. Now we will explore TwoWay data bindings and will check the differences between them. To use a TwoWay binding, we can use a TextBox control. Just replace the existing TextBlock to a TextBox. Also, set the Mode to TwoWay, as shown below:
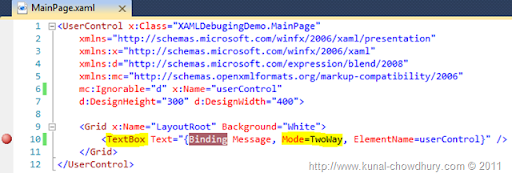
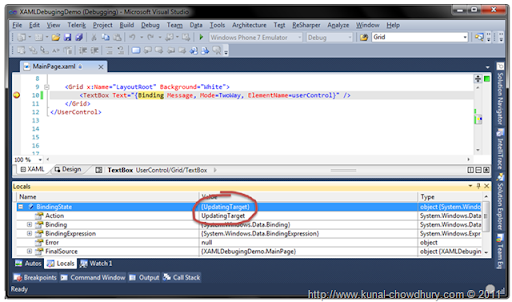
Run your application again and it will break in the XAML breakpoint. As shown in the below screenshot, you will be able to see that the BindingState has the value "UpdatingTarget". This means the binding is set to update the target control.
Press F5 to continue. This will open the Browser window showing the application, which has a TextBox in the UI. The TextBox control also has a text set to it. Change the text and press tab to unfocus from the control.
As we used TwoWay mode, it will fire the event to update the source with the entered value and again stop at the XAML breakpoint.
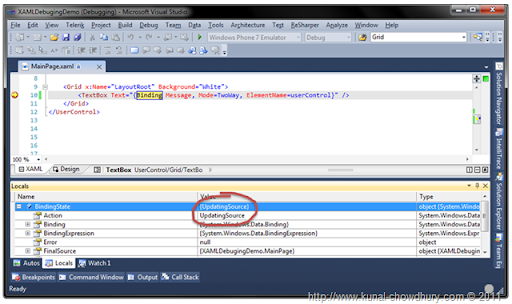
This time if you check the BindingState, you will notice that it has a value called "UpdatingSource". It means, now it is updating the source to reflect the new changes due to TwoWay binding.
What Next?
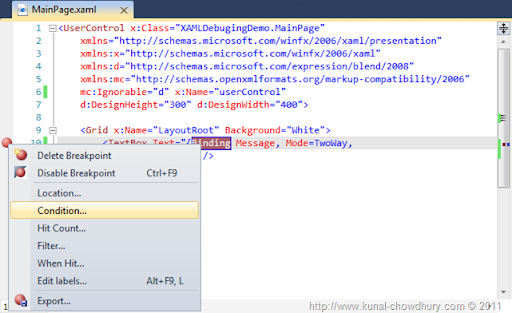
You can now do all the operations that you can do in the code editor with debugging and breakpoint. You can set Conditional breakpoint, Hit count, Filter, Labels in the XAML. Also, you will be able to export the debugging information (which is part of Visual Studio 2010) to an XML file.
Hope this information will help you while debugging XAML data bindings. Install Silverlight 5 Beta and start exploring those features. As always, leave a feedback at the end of the article. Your feedback always count.
Thank you so much for your time to read this article. I will post the next chapters soon. Till then, enjoy learning.
History
- 17th April, 2011: Initial post
