Introduction
Wouldn't it be nice to be able to add a stylish and colorful chart to your Web page with minimal effort and still avoid slow-loading Java applets or server side generated images? Then the JavaScript Chart is just what you need!
The JavaScript Chart supports:
- Several charts on the same page
- No limit on the number of data items in one chart (as long as you have enough space)
- Pass the chart data as a
string in the following format: Item A;1;Item B;2;Item C;3. - Gridlines are automatically created and spaced with appropriate increments depending on the highest value in the data range
- Choose if item values should be displayed or not on each individual chart
- Choose if the chart legend should be displayed or not
- Each data item will automatically get a different matching color
- Each chart can be rendered in debug mode, showing some useful information if the chart is not displayed as expected
- Modification of some of the layout parameters with CSS
This small utility will simply take a semi-colon delimited data string (the delimiter can be changed) and generate a chart for you. You can add several charts to the same page and there is no limit to how many data items you can have in one chart, just as long as you have enough space in your page.
This code is by no means perfect and I'm sure there is lots of room for improvements, but hopefully you will find it useful.
Background
I was searching around to find a client-side JavaScript chart without much success, so I decided to write my own. Then, when coming here to The Code Project to upload my solution, I stumbled across the excellent article "Cool Graph Object to Plot Column and Line Graphs in your Web Pages." by Wagner DosAnjos. Ah, well... Even though the functionality is very similar, I guess there are also some differences, so I'll post my solution here anyway.
Using the Code
Include the JavaScript file in your Web page HEAD section:
<script language="javascript" type="text/javascript" src="jschart.js"></script>
Create a DIV element in your Web page and give it an ID attribute. This will be the container for your chart.
If you do not specify any width or height attributes, the following default values will be used: Width: 100%, Height: 300px. You can override those default values with your DIV element and you can also position the element if you'd like.
<div id="myChart" style="width:60%;"></div>
Now we need to create the actual chart object and assign it to the container. In the sample, I created a small function that is called from the onLoad-event.
Imagine that the chart data string is generated from a database SQL query, a Web Service, an Ajax call to some datasource, or whatever you decide.
<script language="javascript" type="text/javascript">
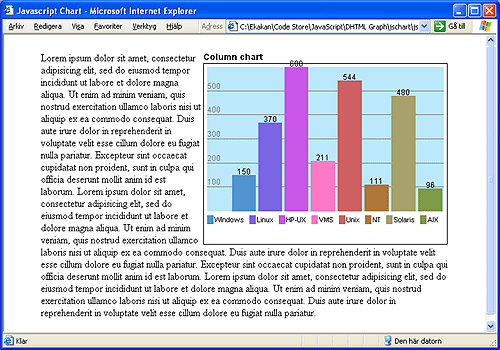
var chartData =
"Windows;150;Linux;370;HP-UX;600;VMS;211;Unix;544;NT;111;Solaris;480;AIX;96";
function initCharts() {
var chart = Chart;
chart.init("myChart");
chart.title = "Column chart"
chart.type = "column";
chart.debug = false;
chart.showLegend = true;
chart.showValues = true;
chart.setData(chartData);
chart.render();
}
</script>
Now add the function to the BODY onLoad-event.
<body onload="initChart()">
Refer to the file jschart_demo.html (available for download with this article) for a complete sample.
History
- 1.1, 2007-May-01: Handle errors for incorrect data and more debug information
- 1.0, 2007-Apr-01: Article created
