|
Hello,
i found this an liked it very much. I am using VB 2010 Express and whenn starting the sample it works. but i do get the following message:
Warnung 1 Der Typ "TestApplication.GanttChart" wurde nicht gefunden. Stellen Sie sicher, dass auf die Assembly, die diesen Typ enthält, verwiesen wird. Wenn dieser Typ Teil Ihres Entwicklungsprojekts ist, stellen Sie sicher, dass das Projekt mithilfe der Einstellungen für die aktuelle Plattform oder eine beliebige CPU erstellt wurde. 0 0
My Questions:
How do i get rid off that message because i want to write a deliverable application ?
Where do i find the control object to integrate it in my own applications/forms ?
Are there any references /DLL or anything to load to get the control ?
Greetings Matthias
|
|
|
|
|
Hello,
how to make signatures on blocks?
Sorry, My English is bad!
|
|
|
|
|
Hi there,
Firstly big thanks to Adagio.81 for your contribution and time in making this control!
I've converted the GanttChart to C#, but I'm having difficulty with it if anyone can help on these 2 issues (class added below)?
1) Initially it was causing VS to crash so I've temporarily excluded the paint method from firing when in design mode
2) It's loading all bars with 1 pixel width irrespective of the values you put in?
Sample Bars:
ganttChart1.FromDate = new System.DateTime(2009, 1, 1, 0, 0, 0);
ganttChart1.ToDate = new System.DateTime(2009, 12, 31, 0, 0, 0);

List lst = new List();

lst.Add(new BarInformation("Row 1", new System.DateTime(2009, 1, 1), new System.DateTime(2009, 5, 1), Color.Gray, Color.LightGray, 0));
lst.Add(new BarInformation("Row 2", new System.DateTime(2009, 1, 1), new System.DateTime(2009, 7, 1), Color.Gray, Color.LightGray, 1));
lst.Add(new BarInformation("Row 3", new System.DateTime(2009, 5, 1), new System.DateTime(2009, 8, 1), Color.Gray, Color.LightGray, 2));
lst.Add(new BarInformation("Row 2", new System.DateTime(2009, 10, 1), new System.DateTime(2009, 12, 1), Color.Gray, Color.LightGray, 3));
lst.Add(new BarInformation("Row 1", new System.DateTime(2009, 8, 1), new System.DateTime(2009, 11, 1), Color.Gray, Color.LightGray, 4));

foreach (BarInformation bar in lst)
{
	ganttChart1.AddChartBar(bar.RowText, bar, bar.FromTime, bar.ToTime, bar.Color, bar.HoverColor, bar.Index);
}
Class:
http://pastebin.com/RdttF899
Kind Regards
Chris
___________________________
"There are 10 types of people in the world.
Those that understand binary... and those that don't!"
|
|
|
|
|
Hi again,
I've posted new changes to the C# version of the Gantt Chart - http://pastebin.com/b6HsgvXN[^]
It's now displaying the bars and layout correctly. I'm currently working on (adding) a "BarChanging" event for the control.
Will keep you posted.
Kind Regards
Chris
___________________________
"There are 10 types of people in the world.
Those that understand binary... and those that don't!"
|
|
|
|
|
Hallo 
great Project - very nice
How can i add more Rows?
I trying this for testing.....
Dim lst As New List(Of BarInformation)
lst.Add(New BarInformation("Row 1", New Date(2011, 7, 3), New Date(2011, 7, 5), Color.Aqua, Color.Khaki, 0))
lst.Add(New BarInformation("Row 2", New Date(2011, 7, 1), New Date(2011, 7, 2), Color.AliceBlue, Color.Khaki, 1))
lst.Add(New BarInformation("Row 3", New Date(2011, 7, 5), New Date(2011, 7, 7), Color.Violet, Color.Khaki, 2))
lst.Add(New BarInformation("Row 4", New Date(2011, 7, 3), New Date(2011, 7, 5), Color.Aqua, Color.Khaki, 3))
lst.Add(New BarInformation("Row 5", New Date(2011, 7, 6), New Date(2011, 7, 5), Color.Aqua, Color.Khaki, 3))
but the row 5 overwrite row 4.
Can you help me?
|
|
|
|
|
Try to change the row index number for the last row. Both row 4 and 5 is set to use row index 3
Color.Aqua, Color.Khaki, 3))
The bolded part is the row index. Change that number to 4 and it will add a new row. The first row has index 0, second row has index 1, etc
Hope that helped
|
|
|
|
|
 ohhh sh*t ohhh sh*t
i see a lot of tree .... but can't see the forest 
Thanks it works
|
|
|
|
|
|
How Can add another text column HELP
|
|
|
|
|
|
I found the code that caused the ghost bars and I fixed it for you:
If bar.StartValue < FromDate Then
   lengthTimeSpan = endValue - FromDate
Else
   lengthTimeSpan = endValue - bar.StartValue
End If
Now bars won't draw when they don't need to be drawn.
|
|
|
|
|
Hello,
First of all I wanted to thank you for your amazing control, it has been a real life-saver for me!
I have been trying to make the chart bar a bit "dynamic", I can increase / decrease the days, go to month view, etc...
But I have encountered a small glitch, when I navigate to the next day there is a bar that shouldn't be there (also nothing happens when I hover over it)
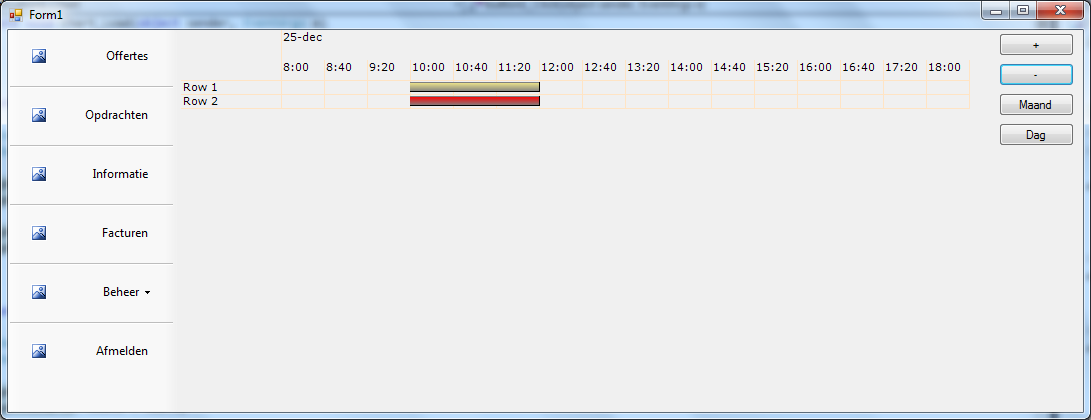
This my example: I added an event on the 25th of december, from 10 to 12.
public Chart()
        {
            InitializeComponent();

            ganttChart1.FromDate = new DateTime(2012, 12, 24, 08, 0, 0);
            ganttChart1.ToDate = new DateTime(2012, 12, 24, 18, 0, 0);

            DateTime test = new DateTime(2012, 12, 25, 10, 00, 00);
            DateTime test2 = new DateTime(2012, 12, 25, 12, 00, 00);

            ganttChart1.AddChartBar("Row 1", null, test, test2, Color.Aqua, Color.Khaki, 0);}
            ganttChart1.AddChartBar("Row 2", null, test, test2, Color.Red, Color.DarkRed, 1);
This appears correctly like this: [^]
Now I used this code to navigate to the next day:
private void button1_Click(object sender, EventArgs e)
{
    DateTime newFrom = ganttChart1.FromDate.AddDays(1);
    DateTime newTo = ganttChart1.ToDate.AddDays(1);

    ganttChart1.FromDate = newFrom;
    ganttChart1.ToDate = newTo;

    ganttChart1.PaintChart();
    ganttChart1.Refresh();

}
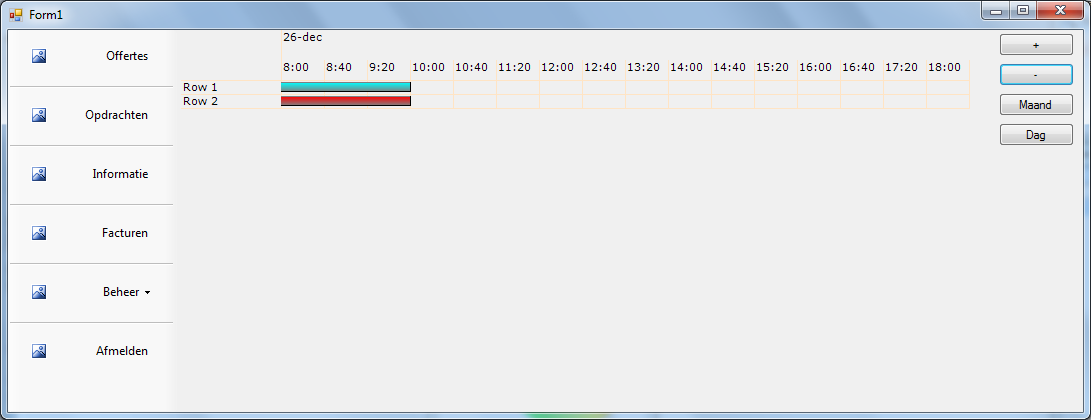
But when I click that button, a strange chart bar appears from the beginning of the Gantt Chart (no matter what the start hour is), it's also the exact same length as the normal event on the previous day. http://localhostr.com/file/f2HdDA2/gantt_2.png[^]
I have no idea what's causing this. This "Ghost" chart bar doesn't appear when I go back in the days or when I go to month view.
private void button2_Click(object sender, EventArgs e)
{
    DateTime newFrom = ganttChart1.FromDate.AddDays(-1);
    DateTime newTo = ganttChart1.ToDate.AddDays(-1);

    ganttChart1.FromDate = newFrom;
    ganttChart1.ToDate = newTo;

    ganttChart1.PaintChart();
    ganttChart1.Refresh();
}

private void btnMaand_Click(object sender, EventArgs e)
{
    DateTime newFrom = new DateTime(ganttChart1.FromDate.Year, ganttChart1.FromDate.Month,1);
    DateTime newTo = new DateTime(ganttChart1.ToDate.Year, ganttChart1.ToDate.Month, 31);

    ganttChart1.FromDate = newFrom;
    ganttChart1.ToDate = newTo;

    ganttChart1.PaintChart();
    ganttChart1.Refresh();
}
I'm sorry to bother you with this problem, but I can't figure it out.
Thanks,
Thomas
|
|
|
|
|
Do you have c# version??I want to study it.Thanks!
|
|
|
|
|
You could simply open the sample project, change the project settings to "library" instead of "executeable", possibly change its name and namespace there also to "Gantt" (and if you want to, remove the Form1.vb from the project).
Compile it (preferably as Release, not Debug).
Pick your new "Gantt.dll" (or "Testproject.dll" if you left the project name) from the bin/Release Subfolder of the project, and copy it to your C# project folder (or even better under a subfolder there, like "libs").
In your C# project you can now simply right-click on "References", "Add reference", and "Browse" to the dll to add it.
Now you have the Gantt (namespace) available (possibly again with "using Testproject;" instead of Gantt if you didn't change that), and if you want to further add it to your designer, you could even do that by right-clicking at your custom project components header in the "Toolbox", click on "Select elements", browse again to your dll and add it, voila.
Works very well for me
|
|
|
|
|
|
Not working very well. The tool tips are buggy but good work anyway.
modified 31-Dec-11 1:35am.
|
|
|
|
|
thanks maan if only you knew how manny lives you have saved you are a hero
|
|
|
|
|
Exactly what I was about to write. Massive timesave and excellent tool.
|
|
|
|
|
i need some help i need to add a text box for adding date ranges near row number column
can u help me with that i really need this help
|
|
|
|
|
hj Adagio
I want to use this chart in C# form for studying
Could you help me convert this code?
Thanks so much!^^
|
|
|
|
|
I don't have a C# version of this code available, can't help you there, sorry
But you can try to get some help from the vb.net to C# converters that are available. They aren't going to make it perfect, but might help you convert it
|
|
|
|
|
|
rongconmocrang wrote: I want to use this chart in C# form for studying
Could you help me convert this code?
Hi, Check this blog post .NET Code Conversion[^]
|
|
|
|
|
I learn VB.Net and GDI+ just to make ganttchart and s curve in my application, and you open my view widely by this code and nice control. Thank you. May God bless you for success life.
|
|
|
|
|
Thanks, glad you like it
I'm not good at GDI+ either, but I did learn a lot from doing this project
|
|
|
|
|


 General
  News
News  Suggestion
  Question
  Bug
Bug  Answer
  Joke
Joke  Praise
  Rant
Rant  Admin
Admin 


