Introduction
This is not a tutorial about Web Services and their usage. The usage of this technology is well known across the software industry.
The purpose of this article is to show a method for “how to intercept Web Service calls and show in screen”. We will work directly on the Worker
process. Unfortunately, with sniffers, we can’t get traffic from localhost.
OK, let’s start:
Suppose you have an application which is calling a WebService.
- Open Windows Debugger: windbg.exe process.
- Press F6 and attach the w3wp.exe process.
- Once we get the process attached, execute the command (.loadby sos mscorwks in the case of .NET Framework < 4.0): .loadby sos mscoreei.
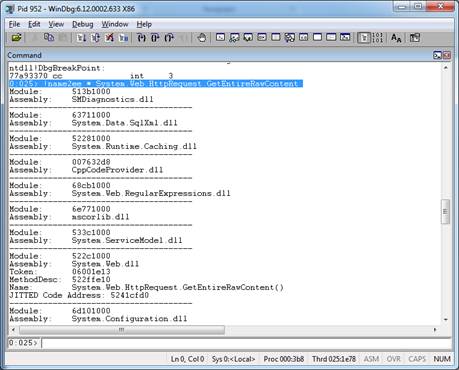
- After deep research, I found an interesting function which could be useful:
System.Web.HttpRequest.GetEntireRawContent. - Let’s try to see where this function is JITted:
!name2ee * System.Web.HttpRequest.GetEntireRawContent

- The JITted address is 5241cfd0, so let’s put a breakpoint right there:
bp 5241cfd0. - Use your application and it will get frozen because the breakpoint was launched.
- On investigation, this function runs and returns the
System.Web.HttpRawUploadedContent class. To run this method until the end, let’s put the pt command. 
- By simple examination, we can see that this returns on the
@eax register all the variables with the class
HttpRawUploaded. Let us see the _data field. 
- Good, we have the entire content in
byte[] of the WebService call.
How can we dump in screen every time this function is called? .printf "%ma",poi(eax+4)+8, where 4 is the offset to get the
data in this class, eax is the return address of this method, and 8 is the address of the first char in the Web Service. %ma means ANSI characters. 
- Let’s delete the first breakpoint and put a new one at the end of this function:
bc *. - Let’s put: Bp eip “.printf \"\\n%ma\",poi(eax+4)+8;gc”.
- We now have all the calls of the Web Service for monitoring.

