WMI Query Trace
According to the definitions: Windows Management Instrumentation (WMI) is a set of extensions to the Windows Driver Model that provides an operating system interface through which instrumented components provide information and notification. WMI is Microsoft's implementation of the Web-Based Enterprise Management (WBEM) and Common Information Model (CIM) standards from the Distributed Management Task Force (DMTF).
This is NOT A TUTORIAL ABOUT WMI. The purpose of this article is to show how to capture the WMI queries sent to the system in plain text using assembler and a powerful debugger. Not sure if there is any WMI Profiler in the market, but the purpose is just to show how to do this from your app. There are a lot of ways to do this and sometimes could be dependent on the client application. If you need specific help, do not hesitate to contact me. Probably the workaround for different applications is totally different. This article is oriented to mid level to expert users of Windows debugger and escalation engineers.
To start, let's check the famous Information System from Microsoft (Información del sistema in Spanish).
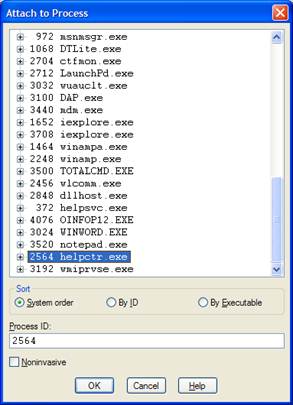
- Open System Information. Start->Programs->Accessories->System Tools->System Information. The process is: helpctr.exe
- Open Windows debugger tool (This tool can be found for free at the Microsoft web site). This is the preferred tool for escalation engineers.
- Attach this process to the
Windbg, using attach the process option or F6.

- After deep research trying to search for functions like
ExecuteQuery, ExecWmi, or any other words, I found that CWbemSvcWrapper::XWbemServices::ExecQuery which is included on fastprox library could be useful. Let’s put a breakpoint right there:
bp fastprox!CWbemSvcWrapper::XWbemServices::ExecQuery
- Continue to run the application by using G or F5

- Navigate across the System Information interface.
- If the interface gets frozen, a breakpoint has been launched, return to the Windows Debugger console.
- Examine the stack of the thread recently executed by using
ddu esp which means give me all the Unicode strings (dda for ANSI chars) in the stack starting at the top of the stack:
ddu esp

- Good, we found a nice string in the specific location:
031dfe58 address. But what if in the next iteration, it changes? Is it preferable to have a calculable location? The question is: How many bytes are from ESP register to the parameter? We can calculate it.

- Good, we have 0xc bytes from ESP. To ensure this theory, execute:
.printf "%mu",poi(esp+c)

- Good, we have the way to extract the information from memory. Remember that we are still in the entry point of function:
fastprox!CWbemSvcWrapper::XWbemServices::ExecQuery
- We can put a definitive breakpoint
bp breakpoint, .printf prints %mu Unicode and gc go and continue:
bp fastprox!CWbemSvcWrapper::XWbemServices::ExecQuery
".printf \"%mu\\n\", poi(esp+c);gc"

