Introduction
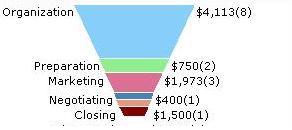
Sometimes, it is required in to display data (financial) in funnel charts for better user experience, and it might be the case that the developer will have to code the funnel display from scratch. The following article helps in writing the code for funnel charts and display them on a web page.
Using the code
While creating the funnel chart, we divide it into different slices. Each slice represents a different stage. In the example below, every slice is displayed in a different color. Go through the code given below. The namespaces System.Drawing and System.Drawing.Imaging are used in the code to draw the funnel slices and to group them together to form a funnel.

public struct Slice
{
public string stageName;
public int value;
public double dollars;
public Point[] coordinates;
public Color color;
}
private Color[] colorPalette = new Color[]
{Color.LightSkyBlue,Color.LightGreen,
Color.PaleVioletRed,Color.SteelBlue};
private const int FUNNEL_HEIGHT = 106;
private const int IMAGE_WIDTH = 291;
private const int IMAGE_HEIGHT = 160;
private const int SLICE_GAP = 1;
private Slice[] funnelSlices;
public void InitFunnel(int count)
{
try
{
maxSlice = count;
funnelSlices = new Slice[count];
chartBMP = new Bitmap(IMAGE_WIDTH, IMAGE_HEIGHT,
PixelFormat.Format32bppArgb);
graphicsObj = Graphics.FromImage(chartBMP);
graphicsObj.FillRectangle(new SolidBrush(Color.White),
0, 0, IMAGE_WIDTH, IMAGE_HEIGHT);
}
catch (Exception ex)
{
throw new Exception("Error initialising funnel", ex);
}
}
private void GetCoordinates(int sliceIndex)
{
int sliceHeight;
if (sliceIndex == 0)
{
funnelSlices[sliceIndex].coordinates[0] = FUNNEL_BOUNDS[0];
funnelSlices[sliceIndex].coordinates[3] = FUNNEL_BOUNDS[3];
}
else
{
funnelSlices[sliceIndex].coordinates[0] =
funnelSlices[sliceIndex - 1].coordinates[1];
funnelSlices[sliceIndex].coordinates[3] =
funnelSlices[sliceIndex - 1].coordinates[2];
}
if (sliceIndex == funnelSlices.Length - 1)
{
funnelSlices[sliceIndex].coordinates[1] = FUNNEL_BOUNDS[1];
funnelSlices[sliceIndex].coordinates[2] = FUNNEL_BOUNDS[2];
}
else
{
sliceHeight = GetHeight(sliceIndex);
funnelSlices[sliceIndex].coordinates[1].Y =
funnelSlices[sliceIndex].coordinates[0].Y + sliceHeight;
funnelSlices[sliceIndex].coordinates[1].X =
GetX(
FUNNEL_BOUNDS[0].X, FUNNEL_BOUNDS[0].Y,
FUNNEL_BOUNDS[1].X, FUNNEL_BOUNDS[1].Y,
funnelSlices[sliceIndex].coordinates[1].Y);
funnelSlices[sliceIndex].coordinates[2].Y =
funnelSlices[sliceIndex].coordinates[0].Y + sliceHeight;
funnelSlices[sliceIndex].coordinates[2].X =
GetX(
FUNNEL_BOUNDS[2].X, FUNNEL_BOUNDS[2].Y,
FUNNEL_BOUNDS[3].X, FUNNEL_BOUNDS[3].Y,
funnelSlices[sliceIndex].coordinates[2].Y);
}
}
private int GetX(int x1, int y1, int x2, int y2, int y)
{
return (x2 - x1) * (y - y1) / (y2 - y1) + x1;
}
public void AddSlice(string name, int value, double dollars, Color sliceClr)
{
Slice newSlice = new Slice();
newSlice.coordinates = new Point[4];
newSlice.stageName = name;
newSlice.value = value;
newSlice.dollars = dollars;
newSlice.color = sliceClr;
funnelSlices[curSlice++] = newSlice;
totalVal += value;
}
public void AddGaps(int i)
{
funnelSlices[i].coordinates[0].Y =
funnelSlices[i].coordinates[0].Y + i * SLICE_GAP;
funnelSlices[i].coordinates[1].Y =
funnelSlices[i].coordinates[1].Y + i * SLICE_GAP;
funnelSlices[i].coordinates[2].Y =
funnelSlices[i].coordinates[2].Y + i * SLICE_GAP;
funnelSlices[i].coordinates[3].Y =
funnelSlices[i].coordinates[3].Y + i * SLICE_GAP;
}
public void PlotGraph()
{
int i;
SizeF strSz;
string label;
labelTop = FUNNEL_BOUNDS[0].Y;
for (i = 0; i < maxSlice; i++)
{
GetCoordinates(i);
}
int labelHeight = (int)graphicsObj.MeasureString("B",labelFont).Height;
for (i = 0; i < maxSlice; i++)
{
AddGaps(i);
labelTop = (funnelSlices[i].coordinates[0].Y > labelBottom + 1 ?
funnelSlices[i].coordinates[0].Y : labelBottom + 1);
labelBottom = labelTop + labelHeight;
graphicsObj.FillPolygon(new SolidBrush(funnelSlices[i].color),
funnelSlices[i].coordinates);
strSz = graphicsObj.MeasureString(funnelSlices[i].stageName, labelFont);
graphicsObj.DrawString(funnelSlices[i].stageName, labelFont,
fontBrush, funnelSlices[i].coordinates[0].X -
strSz.Width, labelTop);
label = ((funnelSlices[i].dollars)).ToString("C0") + "(" +
funnelSlices[i].value.ToString() + ")";
graphicsObj.DrawString(label, labelFont, fontBrush,
funnelSlices[i].coordinates[3].X,labelTop);
SummationValue += float.Parse(funnelSlices[i].dollars.ToString());
TotalDealsOpps += int.Parse(funnelSlices[i].value.ToString());
}
label = (SummationValue).ToString("C0") + "(" +
TotalDealsOpps.ToString() + ")";
strSz = graphicsObj.MeasureString(label, labelFont);
int funnelWidth = (FUNNEL_BOUNDS[3].X - FUNNEL_BOUNDS[0].X);
int labelX = FUNNEL_BOUNDS[0].X + (int)(funnelWidth / 2 - strSz.Width / 2);
int labelY = (int)(IMAGE_HEIGHT - strSz.Height );
graphicsObj.DrawString(label, labelFont, fontBrush, labelX, labelY);
Response.ContentType = IMAGE_FORMAT;
chartBMP.Save(Response.OutputStream, ImageFormat.Jpeg);
}
All the above code should be placed in an ASPX page code-behind. The page load event of this page will load the data to be displayed. Please go through the code given above and also the attached files. To display the funnel in a web page, the following code can be used:
<div class="blockBody">
<table cellpadding="0" cellspacing="0" border="0">
<tr>
<td align="center">
<img src="FunnelChart.aspx" />
<!--
</td>
</tr>
</table>
</div>
Points of interest
I went through many already available funnel chart code, but found coding and displaying it in a web page is much more fun and easy. This work was much appreciated by my clients when we went live.
