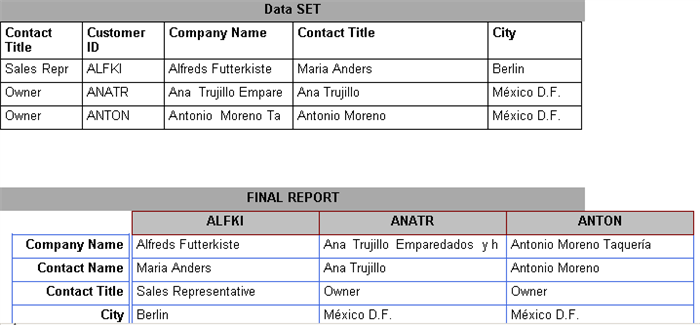
Figure 1
Introduction
This article presents a solution to create a report using SQL reporting service that displays a column data as rows; furthermore, the columns are repeated horizontally for each data row. It also provides a sample source project that uses "Northwind" database for data source purpose.
Background
Problem: Given a Dataset, how to generate a report using SQL server 2005 Reporting Service such that a matrix column is generated for a corresponding data row.
Example:
Given the Dataset as shown in left column of the table (See following table), a solution to display a report using SQL server 2005 reporting service similar to as shown in the right side of table below
Data Set Given:
| | Format of the Report Desired
|
Column1
| Column2
| Column 3
| Column 4
| d11
| d12
| d13
| d14
| d21
| d22
| d23
| d24
| d31
| d32
| d33
| d34
|
| » Report
|
| d11
| d21
| d31
| Row Head1
| d12
| d22
| d32
| Row Head2
| d13
| d23
| d33
| Row Head3
| d14+d13
| d24+23
| d34+d33
|
|
Some existing proposed solutions include:
- Changing SQL query to convert columns to rows using unpivot keyword:(Similar to matrix transpose function)
Problem with this approach is that the displayed result may be much smaller than the number of transposed rows and complicated SQL query - Use MS SQL Serer 2008 tablix control
Using to MS SQL Server 2008 may not be feasible always
It is not clear how to incorporate above solutions and in addition a solution similar to one presented was impossible to find. Therefore the article is intended at providing a simple solution for a specific problem with an example.
Program Description
The solution to achieve the above result is explained using an example. The main idea is to use a Report Element: Matrix with summary column grouping.
(Please refer else where for basics of creating reporting project using Visual studio)
0. Create a Reporting Project
Create a Reporting project and add a new report to the project.
1. Create Data Source:
Figure 2 shows the Data source used in the example along with the results (data set) that is obtained by connecting to "Northwind" sample database. First step is to create a dataset needed for your report.

Figure 2
2. Create Report Definition:
Report Definition shown below is not exactly as shown in figure 1. It slightly distorted to show the distinction of various reporting elements embedded within the report. The report as shown in figure 1 can be obtained by rearranging the report elements (also available in source code)
Figure 3 (shown below) shows the reporting elements used in this project example.

Figure 3:
Steps to create the following report
Step 0: Create a dataset as shown in Figure 2
- Add a Report Element: Matrix to the report (Drag the Matrix report element from the tool bar on to the report)
(Refer to figure 4 for the Matrix element)

Figure 4: - Add Dataset: Customer ID to the column group
Drag the DataSet: Customer ID column from the "Data Set" on the "Column group" of the matrix element (to cell that is labeled as style='font-family: Verdana'>Columns in Figure 4) - Add Report Item: List to the "Data" cell (to cell that is labeled as Data in Figure 4, List is shown in thick maroon border Figure 3)
- Add four Report Elements: text boxes to the list added in step 3. Rearrange the text boxes as you wish
(Drag the text box element from the tool bar on the "Data" Cell above) - Drag Dataset: CompanyName on to the first text box
Continue adding other dataset columns to other text boxes - Set the width of "Rows" to 0 (See also Figure 3 for an illustration)
- Copy the four text boxes (added in step 4) and paste it outside of matrix to add labels to rows (First set of columns in Figure 3)
Change the test of first text box to "Customer Name" and make similar changes to other Labels
Now if everything has gone well, your preview should display a report as shown in Figure 5:

Figure 5:
Now one can reorder the report elements to obtain a report similar to one shown in figure 1. (Also see source code)
