In this post, we will show you how to connect our jQuery chart to MySql database using PHP. We will obtain the data from MySql database and especially the Northwind database. You can download the Northwind database .sql script here and run it into MySQL to create the database.
The first thing we need to do is create the file we’ll connect with. We’ll call this file connect.php.
<?php
# FileName="connect.php"
$hostname = "localhost";
$database = "northwind";
$username = "root";
$password = "";
?>
Now we have our file to do the connection for us and we need to create the file that will run the query and bring the data so our Chart can be populated. We will call the file data.php.
<?php
#Include the connect.php file
include('connect.php');
#Connect to the database
$connect = mysql_connect($hostname, $username, $password)
or die('Could not connect: ' . mysql_error());
$bool = mysql_select_db($database, $connect);
if ($bool === False){
print "can't find $database";
}
$query = "SELECT * FROM `invoices` ORDER BY OrderDate LIMIT 0 , 100";
$result = mysql_query($query) or die("SQL Error 1: " . mysql_error());
while ($row = mysql_fetch_array($result, MYSQL_ASSOC)) {
$orders[] = array(
'OrderDate' => $row['OrderDate'],
'ProductName' => $row['ProductName'],
'Quantity' => $row['Quantity']
);
}
echo json_encode($orders);
?>
The data is returned as JSON. This is it for the connection and data gathering. Let’s see how to add the data we just gathered into our jQuery Chart. Create the index.php file and add references to the following JavaScript and CSS files.
<link rel="stylesheet"
href="styles/jqx.base.css" type="text/css" />
<script type="text/javascript" src="jquery-1.7.1.min.js"></script>
<script type="text/javascript" src="jqxcore.js"></script>
<script type="text/javascript" src="jqxchart.js"></script>
<script type="text/javascript" src="jqxdata.js"></script>
Create a div tag for the Chart.
<div id="jqxChart"></div>
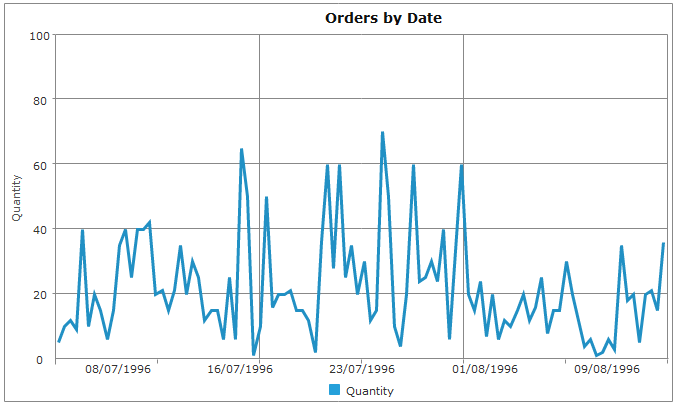
Create your Chart and load the data. We define a source object for the Chart and bind that source to the data.php which returns the JSON data. We also set up the settings object and define the chart’s categoryAxis (horizontal X axis), valueAxis (vertical Y axis) and the chart series. For more information about the Chart’s initialization, visit the help topic at jquery-chart-getting-started.htm.
<script type="text/javascript">
$(document).ready(function () {
var source =
{
datatype: "json",
datafields: [
{ name: 'OrderDate', type: 'date'},
{ name: 'Quantity'},
{ name: 'ProductName'}
],
url: 'data.php'
};
var dataAdapter = new $.jqx.dataAdapter(source,
{
autoBind: true,
async: false,
downloadComplete: function () { },
loadComplete: function () { },
loadError: function () { }
});
var settings = {
title: "Orders by Date",
showLegend: true,
padding: { left: 5, top: 5, right: 5, bottom: 5 },
titlePadding: { left: 90, top: 0, right: 0, bottom: 10 },
source: dataAdapter,
categoryAxis:
{
text: 'Category Axis',
textRotationAngle: 0,
dataField: 'OrderDate',
formatFunction: function (value) {
return $.jqx.dataFormat.formatdate(value, 'dd/MM/yyyy');
},
showTickMarks: true,
tickMarksInterval: Math.round(dataAdapter.records.length / 6),
tickMarksColor: '#888888',
unitInterval: Math.round(dataAdapter.records.length / 6),
showGridLines: true,
gridLinesInterval: Math.round(dataAdapter.records.length / 3),
gridLinesColor: '#888888',
axisSize: 'auto'
},
colorScheme: 'scheme05',
seriesGroups:
[
{
type: 'line',
valueAxis:
{
displayValueAxis: true,
description: 'Quantity',
axisSize: 'auto',
tickMarksColor: '#888888',
unitInterval: 20,
minValue: 0,
maxValue: 100
},
series: [
{ dataField: 'Quantity', displayText: 'Quantity' }
]
}
]
};
$('#jqxChart').jqxChart(settings);
});
</script>
The result is a nice looking jQuery Chart.

CodeProject
