Here I’ll talk about how to integrate your asp.net application with Reporting Service through ReportViewer web control which provides rich functionality to deliver Reporting Service Report through asp.net applications. In real life applications; Analysis Service and Reporting Service on server machine, Web Server another server machine and clients usually on another domain access the website to do something. Let’s take a look on this diagram to visualize what happened in intra applications which one of its functionality shows reports this reports actually based on OLAP Data (SSAS used here)

Here we build OLAP Cube as Report data source. So, let’s begin to build our report based on Cube which built from AdventureWorksDW
1- Open Microsoft SQL Server Business Intelligence Studio (BIDS) 2005\2008
2- Select Business Intelligence Projects from Project types then create Analysis Services project, with name “AdventureWorksInternetSaleCube”
[caption id="attachment_42" align="aligncenter" width="450" caption="Creating Analysis Services Project"]

[/caption] 3- Press OK
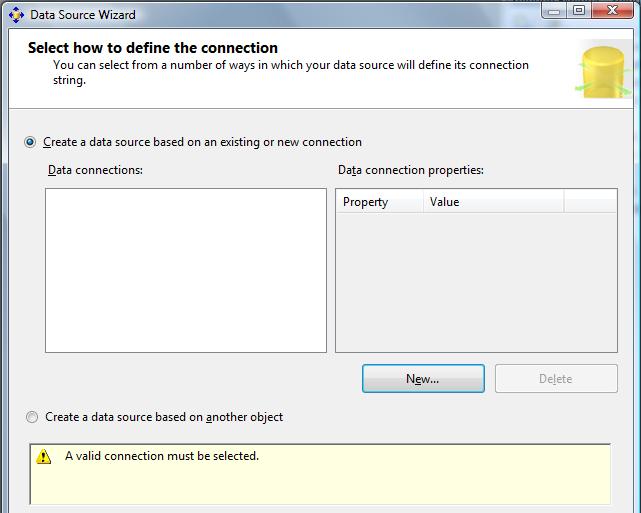
4- Right click on Data Sources -> New Data Source-> Next; to add connection to AdventureWorksDW. Then from Data Source Wizard press on New which gets Connection Manager dialog to setup your connection to AdventureWorksDW

a. Provider: set the default in our case we need to connect to SQL Server instance
b. Server name: The name of the server which has AdventureWordDW in our guide I’m using mine “RamyMahrous-Lap”
c. Log on to the server: You can use Windows\SQL Authentication in our guide I’m using the default setting which is Windows Authentication
d. Connect or database: Select or enter database name: “AdventureWorksDW”
e. Press on Test Connection to validate it. It must say: Test connection succeeded.
f. Press OK

g. You’ll find a new connection has been added to Data connections.
h. Press next
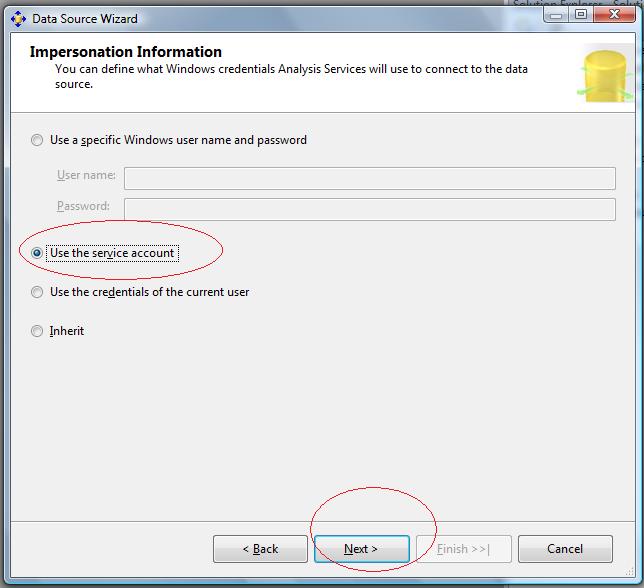
i. You come to Impersonation Information dialog: which is what’s user credential you need to connect by to the Analysis Services (which we will use later to build our Cube on) let’s understand the four choices
i. Use a specific windows user name and password: if Analysis service on another machine i.e not on RamyMahrous-lap in our example I should connect to it using a user has access to its machine. Because Analysis service DOESN’T SUPPORT ELSE WINDOWS AUTHENTICATION.
ii. Use the service account: to use the user credentials which the Analysis service starts with (may be you, may be the administrator)
iii. Use the credentials of the current user: YOU
iv. Inherit: to use the default user. Read more about these options on http://technet.microsoft.com/en-us/library/ms187597.aspx

j. Use the one fits your development environment, for me I’ll use Use the service account
k. Next
l. Set the Data source name to “Adventure Works Data Source”
m. Finish
n. You’ll find Adventure Works Data Source.ds added to Data Sources. Adventure Works Data Source.ds in xml file so you can edit it manually but take care if the file being corrupted it’ll affect all the solution
5- Right click on Data Source Views->New Data Source View->Next; to add our relational tables which is Cube data source few things should you know about Data Source View
a. Every Data Source View associated to single connection as every Data Source View gets data from one location, if you have multiple server which holds data you need to do multi Data Source Views
b. Use mainly to view data without being have any permission on the database directly; Microsoft helps to calm DBAs down.
6- Use our connection “Adventure Works Data Source”, it’s selected by default; Next; you’ll find all available objects (Tables and Views); include those objects FactInternetSales, DimPromotion, DimProduct; then OK; You’ll find Adventure Works DW.dsv created and a new window opens has your three tables and connected together. You can right click on the table to Explore the data on it.


7- Right click on Cubes->New Cube-> Next->Use Existing tables->Next; Data Source View: Adventure Works DW (selected by default); Measure group tables-> “FactInternetSales” or you can press suggest to let it select the measure.
8- Next; Next; Select Dimensions->Select all
9- Next; Finish.
10- Congratulation we’ve built the Cube which be the data source for our report.
I’ve passed on creating Cube elements definitions quickly like what’s Fact, dimension, Measure, KPI, Partitions, etc…. because it needs a lot of posts to talk about each of which in details. But I assume you have enough knowledge about SSAS, SSRS and SQL Server relational database concept.
Conclusion:
We’ve showed building Cube using BIDS to be used later as Report data source
Stay tuned the next part building the Report.
