Introduction
Plotting an XY set is a very common task, a description of the main steps for implementing such a module for the BlackBerry platform is outlined in this article.
Data collected or digested by a given application is more meaningful when displayed as a chart, for instance while developing a Bluetooth app that sampled data from an external device the requirement was to log and plot the data both in real-time and from previous logs, displaying this to the end-users as charts made it much more appealing than showing them flashing numbers with maxs/mins being updated and they could easily remember trends of the data.
In the Blackberry world Apps can be either a Midlet app which to some extent could be device independent or Device app (CLDC) where all of their available APIs are utilized to build a BlackBerry only application similar to the core apps like calendar, browser and so on.
For the chart element outlined here the choice was a CLDC application
Background
In the BlackBerry camp to interact with users the basic entity is the Field, e.g. buttons, labels,dropdowns etc. are defined as Fields (something like VisualStudio controls for our MS refugees) . Since the BlackBerry development platform is Java(actually J2ME) it is very well structured and all of the features from Java such as inheritance, subclassing, etc. can be used extensively. A custom Field fits the requirement for our Chart element.
Within the available BlackBerry UI classes the Mainscreen class is the most commonly used to interact with the user, within this Mainscreen Fields are dropped to make up a GUI interface and a basic set of pre-cooked Fields are available with standard properties and methods.
These fields have some basic behaviour as described on the API documentation but of course they need to be extended. Generic fields cannot be located side by side as by default they take all the space horizontally, the real state for a PDA screen needs to be carefully allocated and it is important to optimize it, to overcome this default behaviour the Manager class allows custom positioning and sizing of fields.
1. The Chart Custom Field implementation
To implement our chart CustomField we will need a Chart class and a chart Manager class.
The chart class carries out the scaling, coloring and data digesting. This charting element is comprised of a grid where the data will be plotted, a scale/transpose method so that the data points can be coherently mapped onto the available screen space and a data digesting routine to loop through the data points.
1.1 Defining the chart Custom Field
The chart Custom Field will be instantiated and positioned on the MainScreen The code shows the extension of the basic Field class.
import net.rim.device.api.ui.*;
.
. more classes as needed
.
import java.util.*;
public class drawCharty extends Field implements DrawStyle
{
private int fieldWidth, fieldHeight, xCoord, yCoord;
private int[] drawSizes;
public drawCharty(int xVal, int yVal, int wVal, int hVal)
{
super(Field.NON_FOCUSABLE);
xCoord = xVal;
yCoord = yVal;
fieldWidth = wVal;
fieldHeight = hVal;
}
public void setXCoord(int xVal)
{
if (xVal != xCoord)
{
xCoord = xVal;
invalidate();
}
}
public int getXCoord()
{
return xCoord;
}
.
. Similar for the Ycoord, width and height
.
1.2 Drawing the grid for plotting
Once the basic field is defined we need to define the space where the data points will be drawn, a chart will usually have a label and some range for its data points. In the Code shown the Vector argument contains objects of the form [maxValue, Label] upon completion the draw_sizes array will
have the location and dimension of the plotting area.
public void draw_the_grid(Graphics this_g, Vector these_labels)
{
double rounded_max;
double rounded_min;
Object curElt;
String[] cur_elt_array;
int left_margin_d, right_margin_d;
switch(these_labels.size() )
{
case 1:
curElt = these_labels.elementAt(0);
cur_elt_array = (String[]) curElt;
rounded_max = Math.ceil(Double.valueOf(cur_elt_array[0]).doubleValue() );
left_margin_d = getFont().getAdvance(Double.toString(rounded_max));
int[] tmp_draw_sizes = {2 + left_margin_d, 25,fieldWidth - 2 + left_margin_d ,fieldHeight - 25 -5};
drawSizes = tmp_draw_sizes;
break;
case 2:
curElt = these_labels.elementAt(0);
cur_elt_array = (String[]) curElt;
rounded_max = Math.ceil(Double.valueOf(cur_elt_array[0]).doubleValue() );
left_margin_d = getFont().getAdvance(Double.toString(rounded_max));
curElt = these_labels.elementAt(1);
cur_elt_array = (String[]) curElt;
rounded_max = Math.ceil(Double.valueOf(cur_elt_array[0]).doubleValue() );
right_margin_d = getFont().getAdvance(Double.toString(rounded_max));
int[] tmp_draw_sizes1 = {2 + left_margin_d, 25,fieldWidth - left_margin_d -right_margin_d -4 , fieldHeight - 25 -5};
drawSizes = tmp_draw_sizes1;
break;
default:
}
this_g.fillRoundRect(drawSizes[0], drawSizes[1], drawSizes[2], drawSizes[3],1,1);
this_g.setColor( Color.LIGHTGREY );
this_g.drawRect(drawSizes[0],drawSizes[1],drawSizes[2],drawSizes[3]);
for(int i=1; i < 5 ; i++)
{
this_g.drawLine(drawSizes[0], drawSizes[1] + (i * drawSizes[3] / 5), drawSizes[0] + drawSizes[2], drawSizes[1] + (i * drawSizes[3] / 5));
this_g.drawLine(drawSizes[0]+ (i * drawSizes[2] / 5), drawSizes[1], drawSizes[0] + (i * drawSizes[2] / 5), drawSizes[1] + drawSizes[3]);
}
switch(these_labels.size() )
{
case 1:
this_g.setColor( Color.RED );
curElt = these_labels.elementAt(0);
cur_elt_array = (String[]) curElt;
rounded_max = Math.ceil(Double.valueOf(cur_elt_array[0]).doubleValue() );
print_axis_values_4_grid(this_g, "mph" , Double.toString(rounded_max) , "0", cur_elt_array[1] , 2 ,0 );
break;
case 2:
this_g.setColor( Color.RED );
curElt = these_labels.elementAt(0);
cur_elt_array = (String[]) curElt;
rounded_max = Math.ceil(Double.valueOf(cur_elt_array[0]).doubleValue() );
print_axis_values_4_grid(this_g, "mph" , Double.toString(rounded_max) , "0", cur_elt_array[1] , 2 ,0 );
this_g.setColor( Color.BLUE );
curElt = these_labels.elementAt(1);
cur_elt_array = (String[]) curElt;
rounded_max = Math.ceil(Double.valueOf(cur_elt_array[0]).doubleValue() );
print_axis_values_4_grid(this_g, "sec" , Double.toString(rounded_max) , "0", cur_elt_array[1] , drawSizes[0] + drawSizes[2] +3 ,1 );
break;
}
1.3. Overriding the Paint event
The Paint event is where we can customize our Field
public void paint(Graphics graphics)
{
graphics.setColor( Color.AQUA );
graphics.fillRoundRect(0, 0, getWidth(), getHeight(), 15, 15);
graphics.setColor( Color.LIGHTBLUE );
graphics.drawRoundRect(0, 0, getWidth(), getHeight(), 15, 15);
graphics.setColor( Color.BEIGE );
draw_the_grid(graphics , labels_vector);
}
1.4. Instantiating the class and the current output
The code below shows
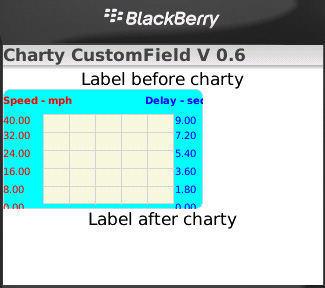
the instantiation. If we were to stop here the output will look like in the figure
.
.
.
LabelField title = new LabelField("Charty CustomField V 0.6", LabelField.ELLIPSIS
setTitle(title);
add(new LabelField("Label before charty",0, -1, Field.FIELD_HCENTER));
drawCharty charty = new drawCharty(35,10, 200,120);
add(charty);
add(new LabelField("Label after charty",0, -1, Field.FIELD_HCENTER));

Here we can see that even though we are passing the coordinates and dimension of our class it is not being placed properly , the Manager class will take care of that.
1.5. Plotting and scaling
The data points need a proper mapping from the data ranges to the screen coordinates, this is accomplished with the scale method shown below.
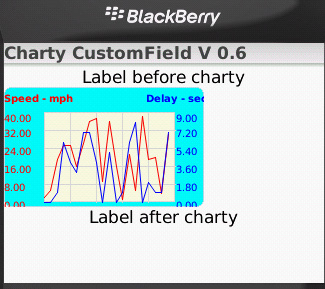
Looping through the data points and calling a drawLine between two successive points will wrap up our Chart CustomField. The data points are passed as a Vector containing the data and our Paint event
will now call the plot_array_list .
private XYPoint scale_point(int this_x , double this_y , XYPoint drawPoint ,
int scr_x , int scr_y , int scr_width , int src_height ,
double maxX , double minX , double maxY , double minY )
{
int temp_x, temp_y;
XYPoint temp = new XYPoint();
if (maxY == minY)
return null;
try
{
temp_x = scr_x + (int)( ((double)this_x - minX) * ((double)scr_width / (maxX - minX)) );
temp_y = scr_y + (int)( (maxY - this_y) * ((double)src_height / (maxY - minY)) );
temp.x = temp_x;
temp.y= temp_y;
drawPoint = temp;
}
catch (Exception e)
{
return (null);
}
return temp;
}
public boolean plot_array_list(Graphics this_g, Vector this_array_list , Vector these_labels , String this_title )
{
int lRow ;
int nParms;
int i, points_2_plot, shifted_idx ;
int prev_x, prev_y ;
int cur_x=0, cur_y=0 ;
XYPoint cur_point = new XYPoint();
cur_point.set(0,0);
double cur_maxX, cur_minX, cur_maxY=20, cur_minY=0, cur_rangeY;
int cur_start_x, cur_points_2_plot;
Object curElt;
String[] cur_elt_array;
draw_the_grid(this_g, these_labels);
try
{
points_2_plot = this_array_list.size();
cur_start_x = 0;
cur_points_2_plot = points_2_plot;
cur_maxX = cur_points_2_plot;
cur_minX = 0;
curElt = this_array_list.elementAt(0);
cur_elt_array = (String[]) curElt;
this_g.setDrawingStyle(Graphics.DRAWSTYLE_AALINES, true);
for( nParms = 1 ; nParms < cur_elt_array.length ; nParms++ )
{
curElt = these_labels.elementAt(nParms -1);
cur_elt_array = (String[]) curElt;
cur_maxY= Integer.parseInt(cur_elt_array[0]);
curElt = this_array_list.elementAt(cur_start_x);
cur_elt_array = (String[]) curElt;
cur_point = scale_point(Integer.parseInt(cur_elt_array[0]), Double.parseDouble(cur_elt_array[nParms ] ), cur_point,
drawSizes[0], drawSizes[1], drawSizes[2], drawSizes[3],
cur_maxX, cur_minX, cur_maxY, cur_minY);
cur_x = cur_point.x;
cur_y = cur_point.y;
prev_x = cur_x;
prev_y = cur_y;
switch (nParms)
{
case 1:
this_g.setColor( Color.RED );
break;
case 2:
this_g.setColor( Color.BLUE );
break;
}
for (lRow = cur_start_x +1 ; lRow< cur_start_x + cur_points_2_plot ; lRow++)
{
curElt = this_array_list.elementAt(lRow);
cur_elt_array = (String[]) curElt;
if (cur_elt_array[0] == null)
cur_elt_array[0] = "0";
if (! (cur_elt_array[nParms ] == null ) )
{
cur_point = scale_point(Integer.parseInt(cur_elt_array[0]), Double.parseDouble( cur_elt_array[nParms ]), cur_point,
drawSizes[0], drawSizes[1], drawSizes[2], drawSizes[3],
cur_maxX, cur_minX, cur_maxY, cur_minY);
cur_x = cur_point.x;
cur_y = cur_point.y;
this_g.drawLine( prev_x, prev_y, cur_x, cur_y);
prev_x = cur_x;
prev_y = cur_y;
}
}
}
invalidate();
return( true);
}
catch (Exception e)
{
return( false);
}
}
With this the plotting is carried out and the output now looks like the figure
below

2. Defining our Manager class for the Chart Custom Field
Our output is almost complete the only issue is positioning the Field,
the companion Manager class completes the implementation
import net.rim.device.api.ui.*;
.
. more classes as needed
.
import java.util.*;
public class chartyManager extends Manager
{
int myHeight;
int myWidth;
public chartyManager()
{
super(Manager.NO_HORIZONTAL_SCROLL |
Manager.NO_VERTICAL_SCROLL);
}
protected void sublayout(int width, int height) {
drawCharty field;
int x_pos=0, y_pos=0;
int numberOfFields = getFieldCount();
for (int i = 0; i < numberOfFields; i++)
{
field = (drawCharty)getField(i);
setPositionChild(field, field.getXCoord(), field.getYCoord());
x_pos=field.getXCoord();
y_pos=field.getYCoord();
layoutChild(field, field.getPreferredWidth(), field.getPreferredHeight());
width = field.getPreferredWidth();
height = field.getPreferredHeight();
myHeight=field.getPreferredHeight();
myWidth=field.getPreferredWidth();
}
setExtent(width + x_pos, height + y_pos );
}
public int getPreferredWidth()
{
return myWidth;
}
public int getPreferredHeight()
{
return myHeight ;
}
}
3. Instantiating the manager class and the final output
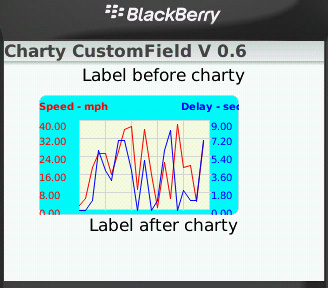
So now we can position the chart anywhere as set by the coordinates. The final syntax below.
.
.
.
LabelField title = new LabelField("Charty CustomField V 0.6", LabelField.ELLIPSIS
setTitle(title);
add(new LabelField("Label before charty",0, -1, Field.FIELD_HCENTER));
drawCharty charty = new drawCharty(35,10, 200,120);
chartyManager myManager = new chartyManager();
myManager.add(charty);
add (myManager);
add(new LabelField("Label after charty",0, -1, Field.FIELD_HCENTER));
The output

Final Thoughts
The classes shown work rather well,
when we needed to do real-time plotting a slight modification of the routine was used where instead of a Vector a Queue data structure was used since we needed to be able plot the data as it came in as well as having a scrolling feature but the basic components were the same. Many more modifications can be applied depending on the requirements.
If instead of a plot a graphic intensive application is required like a RPG(Role Playing Game) the basic concept is still the same the background image is equivalent to the grid and the plot is the gamer navigating through the background image(for instance through a maze) in such case optimization should be looked very carefully since when overlapping bitmaps and making such computations it will be very CPU intensive and the computations should be kept Integer as much as possible
as the float conversions eat up the CPU made even worse when all pixels have to go through some math mill. The basic technique of double buffering should be definitely considered for such graphic intensive apps.
