In this article, I will demonstrate how you can automate generation of dump files based on threshold defined on these custom performance counters.
Introduction
I am a big fan of using the right tool for generating process dumps depending upon what type of scenario you are debugging and what type of constraints you are facing. I have blogged about the case for ADPlus, DebugDiag and ProcDump. These are not the only tools available for creating dump files and there are other means of generating process dumps as well. In general, these tools provide enough flexibility and options for generating dump file for widely needed problem categories like Application Crashes, hangs, memory issues, slow performance, etc. However, sometimes there are situations where you need more flexibility on what event should trigger dump file generation. This article describes how this could be done using Performance Counters, Windows Task Scheduler and ADPlus.
Background
This article assumes you are familiar with basics of production debugging and have some basic know how of dump files. If not, you can watch my video on this topic here.
Performance Counters
Performance Counters provide useful information about how well operation system or any given application is performing. This information could be used to monitor overall health and reliability of application and also to troubleshoot performance bottlenecks, etc. You can also create custom counters and use these to keep track of your application health and stability.
In this article, I will demonstrate how you can automate generation of dump files based on threshold defined on these custom performance counters.
Creating Custom Counters
There are several ways of creating customer counters. Covering all possible methods of creating these custom counters is out of scope for this article, however, I will only discuss steps involved in creating a custom counter using Server Explorer. If you need to learn more about creating custom counters, the article found here could be a good start.
Using Server Explorer is probably simplest way of creating custom performance counter. Just launch Server Explorer from using Visual Studio, right click on Performance Counter node and select Create New Category option as shown in Figure 1.
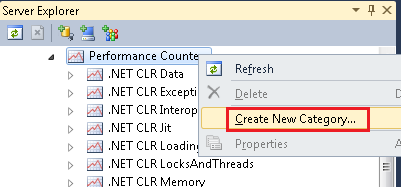
Figure 1: Performance Counter context menu
You will get Performance Counter Builder dialog where you can enter information about Category and also to add individual Performance counters within this category as shown in Figure 2.
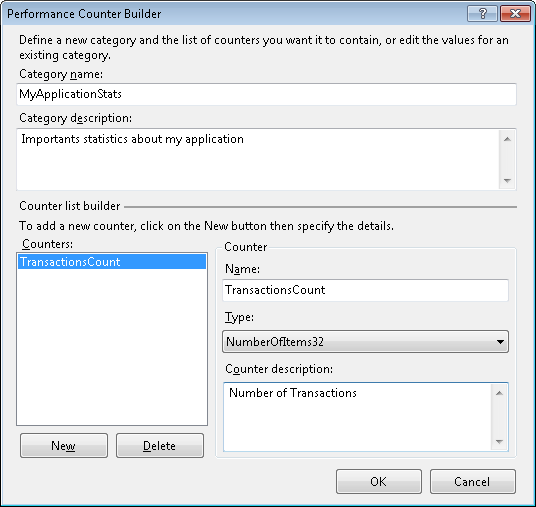
Figure 2: Performance Counter Builder Dialog
Let's assume that we have started using and publishing this counter in application. Also assume that once in a while, TransactionsCount is getting quite high in a production environment and we are not been able to re-produce this problem in house. This situation obviously will make debugging and troubleshooting this problem quite tricky. We will have to adapt Production Debugging techniques, which involves taking a process dump in production environment only when the problem is happening. Challenge is of course how to get the process dump as this problem only happens intermittently. This is where we can use Performance Counter's Data collector to trigger a creating a task to generate process dump only when the process reaches a pre-defined threshold for our custom performance counter.
The listing below shows the code that will cause the TransactionsCount to go high.
private void SimulateHighTransactionsCount()
{
 for (int i = 0; i < 100; i++)
 {
  IncrementTransactionsCount();
  System.Threading.Thread.Sleep(1000 * 2);
 }
}

private void IncrementTransactionsCount()
{
 using (PerformanceCounter TransactionCount = new PerformanceCounter())
 {
  TransactionCount.CategoryName = "MyApplicationStats";
  TransactionCount.CounterName = "TransactionsCount";
  TransactionCount.ReadOnly = false;
  TransactionCount.Increment();
 }
}
Once the code above get executed, you can see custom performance counter go high as shown in Figure 3 below.
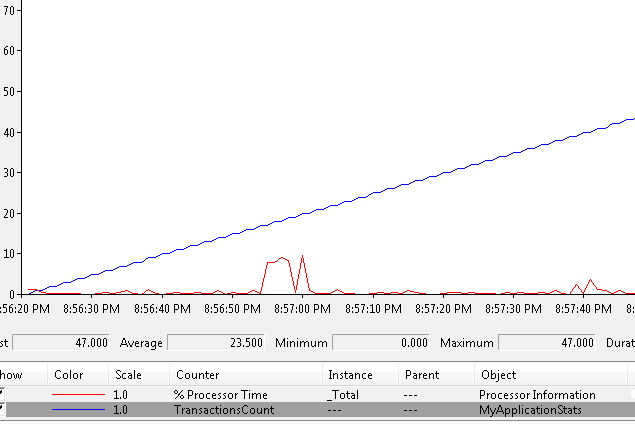
Figure 3: Performance Monitor
Setting up Data-Collector
In order to get a process dump file in the scenario described above, we will first setup a user-defined Data Collector using Performance Monitor. Let's launch the PerfMon, right click on option for User Defined Data Collector Sets and select New -> Data Collector Set option as shown in figure 4 below.
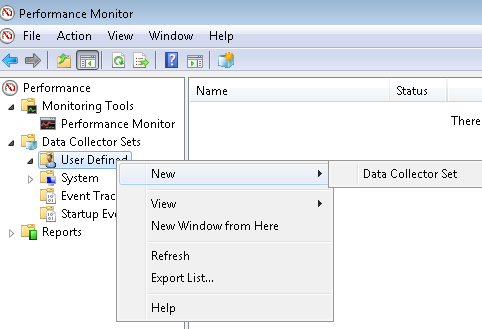
Figure 4: Performance Monitor
At this point, you will get a dialog where you can name your Data Collector. Make sure you select "Create manually" option.
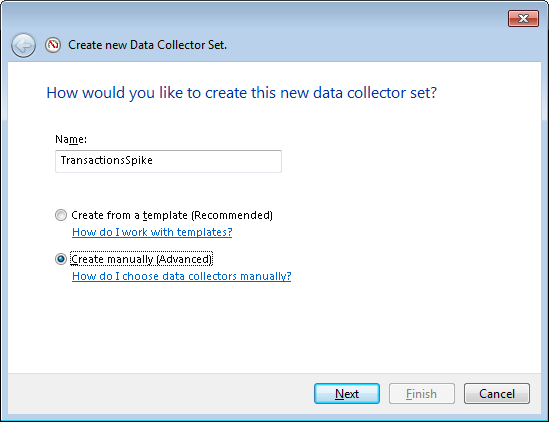
Figure 5: Create new Data Collector dialog
Next dialog will provide you option for adding your performance counter for this Data Collector. Hit Add button here.
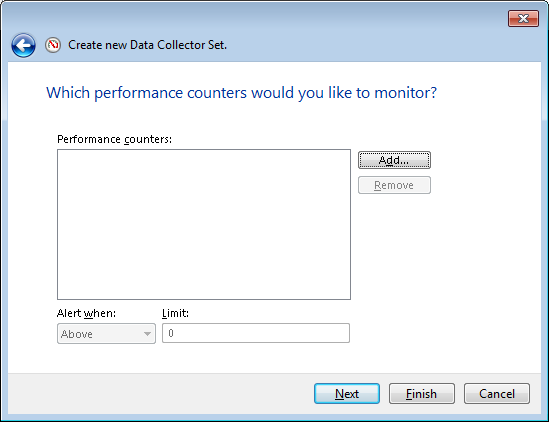
Figure 6: Add Performance Counter in Data Collector
Hitting Add button provides you with a list of performance counter. Select and add our custom performance counter from this dialog as shown in figure 7 below.
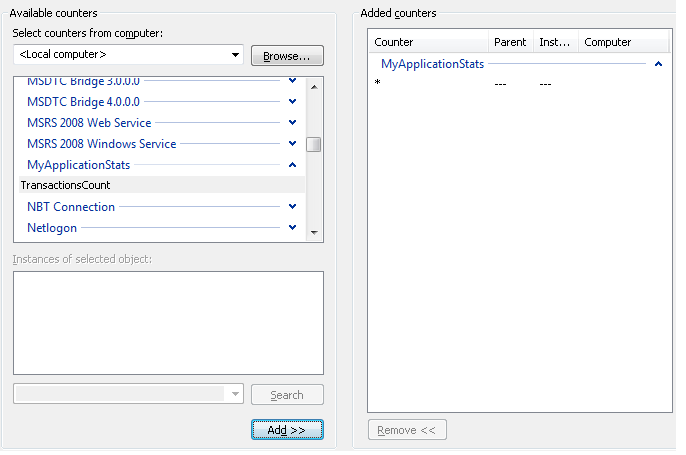
Figure 7: Choose custom performance counter
Next dialog provides you the ability to set the threshold. As shown in figure 8, we want to use 25 as TransactionsCount threshold for generating the dump file.
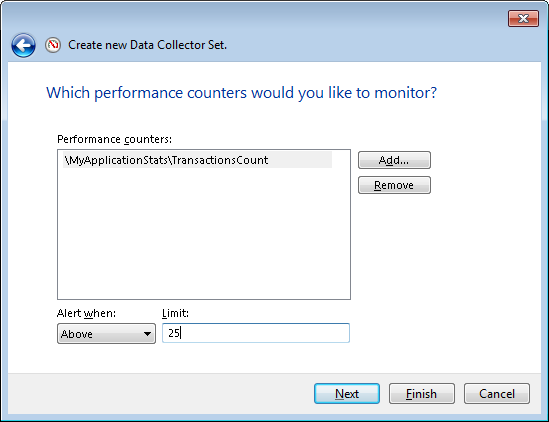
Figure 8: Defined threshold
On next dialog, just hit "Save and close".
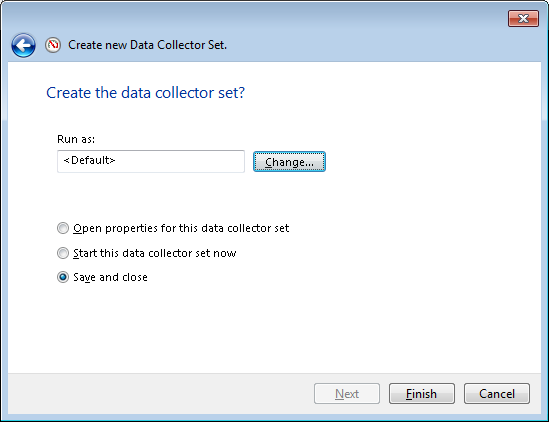
Figure 9: Save your work.
Now there are couple of adjustments that we would like to do in this newly created Data Collector. So click on the properties for this data collector, and you will get a dialog with three tabs, Alerts, Alert Action and Alert Task. First thing we want to do is adjust sample interval in the Alerts tab. For this example, I am adjusting it to 10 seconds, however, for a production environment, this will not be an appropriate value. You may not want to monitor your counter this frequently and be better off using a higher value.
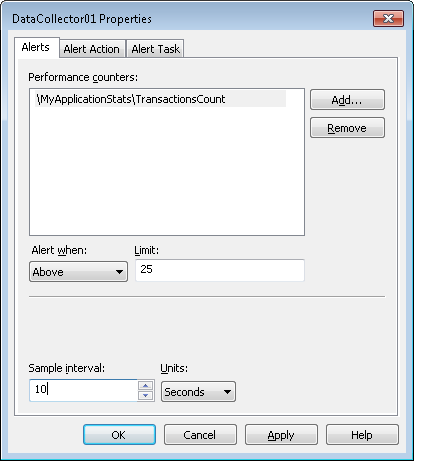
Figure 10: Use an appropriate sample interval
Next thing you want to do here is on the Alert Task Tab. You would like to setup the name of the task that you would like to execute whenever this threshold get hit. The name that you use here is has to match exactly to the name that will be used in the next step when we create a task using Windows Task Scheduler.
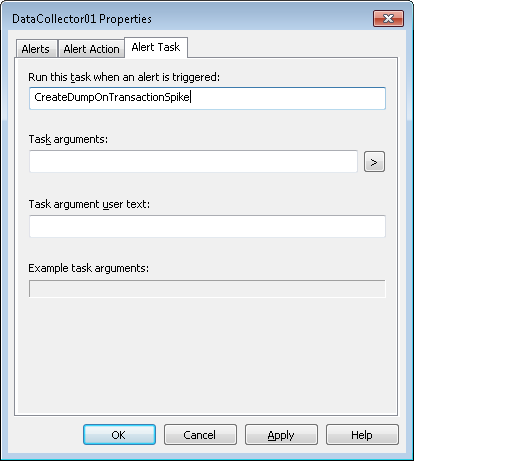
Figure 11: Setup the task that you like to execute when threshold is reached.
Windows Task Scheduler
In order to configure the task that will be executed each time our performance counter threshold is reached, we will launch Windows Task Scheduler and Create a task.
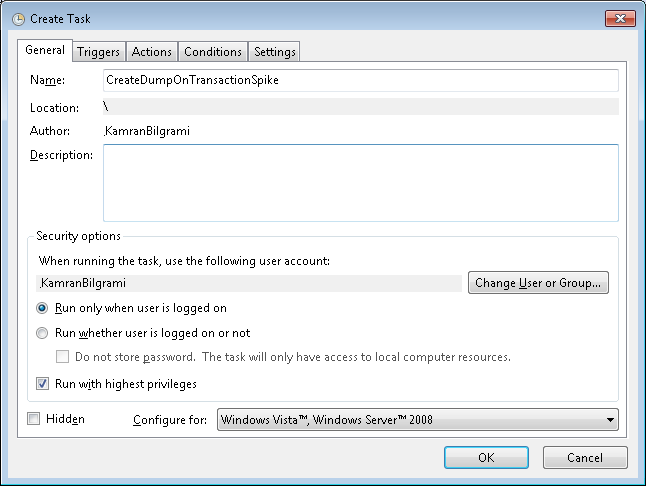
Figure 12: Create Task.
Next, we will setup the Action. In our case, it will be commands that will get executed.
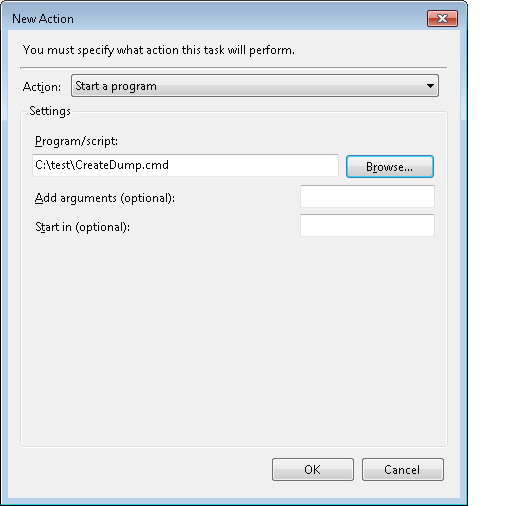
Figure 13: Setup Action
The contents of CreateDump.cmd are as follows:
CD C:\"Program Files"\"Debugging Tools for Windows"
ADPlus -hang -pn CustomPerformanceCounter.exe -o C:\Test
Logman -stop TransactionsSpike
Pause
We are simply running ADPlus in hang mode. This means that as soon as ADPlus command is run, it will attach to the process name CustomPerformanceCounter (configured using -pn switch) and will generate a process dump file in C:\Test folder. Note that we are stopping the TransactionsSpike data collector right after ADPlus is run, otherwise it will continue to keep running the task which in turn will continue to write the dump file. Given the potentially big size of dump files, this is not something you want to have in your production environment.
Our setup is all complete now. We just have to go back and start the data-collector in the Performance monitor as by default, it is created in the stop mode. Now as soon as you start the data collector and the threshold is hit, you should be able see the dump file. Once you have the dump file, you can use any tool like WinDbg or DebugDiag to analyze dump file and find the root cause of the problem.
Summary
In this article, I demonstrated how you can automate process dump file generation based upon custom performance counter threshold using a combination of ADPlus, Performance counters and Windows Task Manager. I hope you find this technique useful.
History
- 13th May, 2012: Initial version
