Memory
leaks in .NET applications are always proven to be the nightmare for
developers. Many times we get "OutOfMemoryException", which is nothing but due
to memory leak only. There are many reasons, which lead to memory leak
situation. For example, sometimes we forget to release unmanaged resources,
dispose heavy objects (i.e., drawing objects), even holding reference of
managed objects, longer than necessary can also lead to memory leaks.
So, if the application
is small, one can analyze the code and figure it out, which object is causing
memory leak. But when it comes to a large application, it is not at all
possible to figure out manually. In that case, we need some tool, which can
help us to figure out the area or object, which is causing memory leak. So,
today I surf internet and came up with a tool called .Net Memory Profiler,
which can do analysis for us and give us the statistics of all the instances.
Ok,
instead of getting more into theory, let’s jump quickly to the demo. I have a
windows form application named "MemoryLeakAnalysis". Now I open memory
profiler, which comes up with the below screen. Profiler can be run in two
different modes as interactive (normal mode with UI shown below) and
non-interactive mode (can only be used for automated testing as part of script.
It will not show any window).
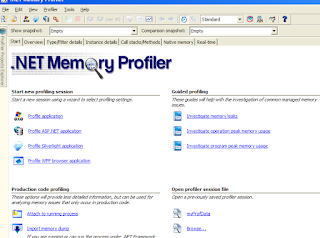
Click
on ‘Profile application’ and select the exe of your application, as shown
below. If require, command line argument can also be provided.
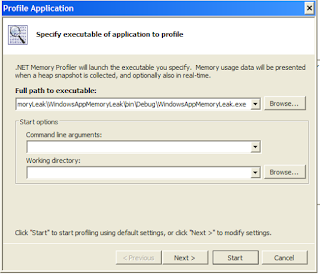
On
click of next, you can decide the profiling level as Very low, Low, Medium,
High, etc. Moving further, you can also decide, whether you want to enable
unmanaged resource tracker (collects information about handles, GDI handles,
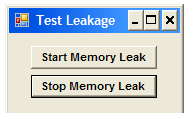
etc), and finally click on start. Clicking on start will launch your
application (here my application name is Test Leakage).
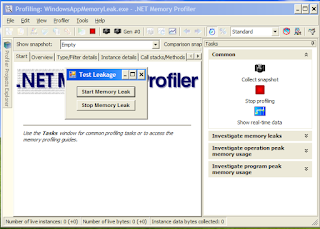
In the right
hand side, you can see various options as Collect snapshot, Stop profiling,
Show real-time data. And just below that, we have ‘Investigate memory leaks’.
On clicking of ‘Investigate memory leaks’, you will get the list of major
steps, which needs to be taken up, in order to analyze leakage.
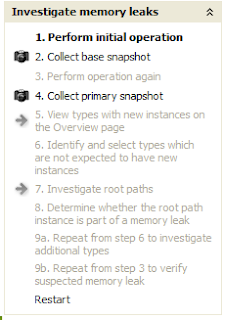
Now the actual investigation starts.
- Perform initial operation - Perform the operation you suspect is memory leaking (e.g., open a document, work with
it and then close it). Performing an initial operation will make sure that instances that are only created once are not included in the memory leak
investigation. In my case, I’ll click on ‘Start Memory Leak’ button and after a while, I’ll click on ‘Stop Memory Leak’.
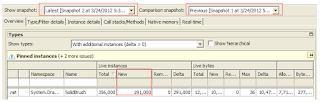
- Collect base snapshot - The base snapshot will be used as a reference when looking for unexpected new
instances that are created by the operation. Once the snapshot is taken, we will come up with below screen, with some statistics.
- Perform operation again - Again we will perform the operation, which we suspect are leaking memory. Because,
this operation will give us new snapshot for comparison. In my application, I will again click on ‘start Memory Leak’ button:
- Collect primary snapshot - The primary snapshot will be used when investigating new instances that might be
part of memory leak.
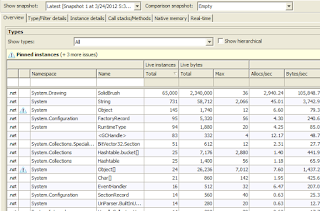
- Identify the types with New instances - Instances
shown under Overview tab (highlighted one), are the one’s, which are not garbage collected.
- Identify the types which are not expected to have New instances - For those instances, we will find that value of New column is 0, which clearly
states that that object is already collected by GC.
- Investigate root path - Root
path can be extremely useful for identifying memory leaks. Shortest path provide information about why instances are not garbage collected. You can use
browse buttons to locate a root path that you’d like to investigate further.
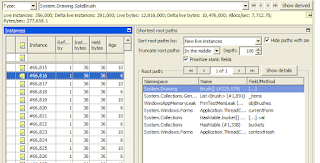
- Determine whether root path instance is part of memory leak - Instance graph and Allocation call stack will provide information about how the instance
is used, why it has not been garbage collected, and how it was created. This information can be used to determine, whether instance is part of memory leak or not.
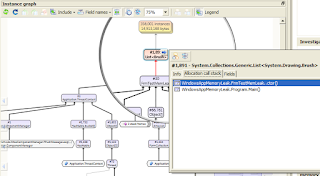
- Steps from 6 to 8 can be used to analyze another types.
So, by looking at the instance graph and red arrows shown above, will help us the identify, where exactly leak is happening.

