cpumon2 and cpumonRcv
Although this project is not yet finished, the main function works very well: viewing
CPU usage remotely and capture data to database for later analysis.
Some of the ideas and code is inspired by a CPU usage article at
http://www.codeproject.com/Articles/159461/Mobile-Processor-Usage. Further on I got more questions the last days like “Why is app x running slow?” or “When I start that app, the system gets slow and taskmanager shows a high CPU usage.”
Here are two tools to capture CPU usage of a windows mobile device remotely via a TCP/IP connection.
Before you read on, the code is by far not perfect and there are still many improvements possible. But if you need a working remote cpumon, here we go…
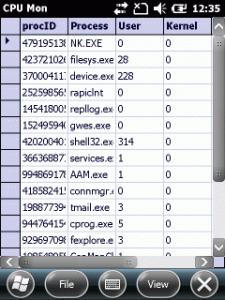
cpumon on device
Why another cpumon or taskmanager like app? Simply as you may test an application without having to switch between the app and taskmanager to see cpu usage. Switching back and for may also interrupt the workflow in your app.
cpumon creates snapshot of all processes and threads periodically including there used user and kernel times. On windows ce, the kernel times are always zero, but that may change in future and so I included that in the statistics info too.
First, cpumon creates a snapshot of all processes with there process ID’s. Then another snapshot of all threads is created with there owner ProcID, thread ID and usage times. There is a delay between two snpashots further called duration. The threads are assigned to the processes and there times (user and kernel) are summarized. This statistics snapshot is put in a queue. This will repeat all 3 seconds. At the end of a statistics set, another thread is released that dequeues the data and sends it using an UDP socket. I decided to use UDP broadcast as this is fast and requires no client/server connection. At the end of a set, one <EOT> packet is sent to let the host know, that a set has been
transferred.
The statistic data is also shown in the GUI of cpumon, but this is only for reference.
cpumonRcv
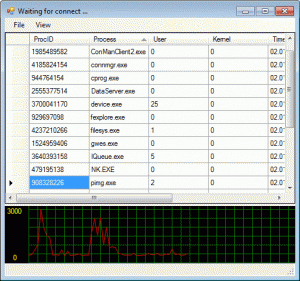
cpumonRcv is a desktop csharp app that listens for UDP broadcasts of cpumon. It converts the received bytes back to a statistic set of processes and threads and en-queues the data until an EOT packet has arrived. Then the data is saved to a local database and can be used for later analyzes. Additionally every new statistic data packet will update a live view.
The code
On the device
A process has an exe name and a list of threads. Every thread is captured with the time it has spend in user and kernel space. The threads and processes are recorded with a timestamp and the duration of two consecutive snapshots. If you sum the user times of all threads of a process and divide that by the duration and multiply with 100 you get the percentage the process has used of the processors time.
The above is reflected in a thread and a process class. Further on, these classes include a conversion from/to byte arrays. These byte arrays build the packet that is send via UDP broadcasts.
The transmitter (cpumon) and receiver share the same code for process and thread class. So the receiver can easily transform byte packets back to processes and threads.
The main class is ProcInfo. It starts the snapshot (usage) thread and the socket thread.
public ProcInfo()
{
statisticsTimes = new Dictionary<string, ProcessStatistics.process_statistics>();
eventEnableCapture = new AutoResetEvent(true);
eventEnableSend = new AutoResetEvent(false);
procStatsQueueBytes = new Queue<byte[]>();
myThreadSocket = new Thread(socketThread);
myThreadSocket.Start();
myThread = new Thread(usageThread);
myThread.Start();
}
The snapshot thread captures a snapshot of processes and threads and adds the data to a dictionary and en-queues it for the socket thread. I use a dictionary for the process stats as this automatically inserts or updates process data. So I do not need to look first, if a process is already known or not and if I have to update existing data or add new data. Another reason is that the code has to look up a the thread
list for existing data (TryGetValue) to build the new stats.
void usageThread()
{
try
{
int interval = 3000;
uint start = Process.GetTickCount();
Dictionary<uint, thread> old_thread_List;
string exeFile = Process.exefile;
Dictionary<uint, process> ProcList = Process.getProcessNameList();
DateTime dtCurrent = DateTime.Now;
Dictionary<uint, thread> new_ThreadList;
uint duration;
long system_total;
long user_total, kernel_total;
long thread_user, thread_kernel;
DWORD dwProc;
float user_percent;
float kernel_percent;
ProcessStatistics.process_usage usage;
ProcessStatistics.process_statistics stats = null;
string sProcessName = "";
List<thread> processThreadList = new List<thread>();
List<threadStatistic> processThreadStatsList =
new List<threadStatistic>();
while (!bStopMainThread)
{
eventEnableCapture.WaitOne();
old_thread_List = Process.GetThreadList();
System.Threading.Thread.Sleep(interval);
new_ThreadList = Process.GetThreadList();
duration = Process.GetTickCount() - start;
ProcList = Process.getProcessNameList();
dtCurrent = DateTime.Now;
system_total = 0;
statisticsTimes.Clear();
foreach (KeyValuePair<uint, process> p2 in ProcList)
{
processThreadList=new List<thread>();
processThreadStatsList = new List<threadStatistic>();
user_total = 0;
kernel_total = 0;
sProcessName = p2.Value.sName;
dwProc = p2.Value.dwProcID;
foreach (KeyValuePair<uint, thread> kpNew in new_ThreadList)
{
thread_user = 0;
thread_kernel = 0;
if (kpNew.Value.dwOwnerProcID == dwProc)
{
thread threadOld;
if (old_thread_List.TryGetValue(kpNew.Value.dwThreadID, out threadOld))
{
thread_user=Process.GetThreadTick(kpNew.Value.thread_times.user) -
Process.GetThreadTick(old_thread_List[kpNew.Value.dwThreadID].thread_times.user);
user_total += thread_user;
thread_kernel =Process.GetThreadTick(kpNew.Value.thread_times.kernel) -
Process.GetThreadTick(old_thread_List[kpNew.Value.dwThreadID].thread_times.kernel);
kernel_total += thread_kernel;
}
thread threadsOfProcess = new thread(kpNew.Value.dwOwnerProcID,
kpNew.Value.dwThreadID, kpNew.Value.thread_times);
processThreadList.Add(threadsOfProcess);
threadStatistic threadStats =
new threadStatistic(
kpNew.Value.dwOwnerProcID,
kpNew.Value.dwThreadID,
new threadtimes(thread_user, thread_kernel),
duration,
dtCurrent.Ticks);
processThreadStatsList.Add(threadStats);
}
}
user_percent = (float)user_total / (float)duration * 100f;
kernel_percent = (float)kernel_total / (float)duration * 100f;
system_total = user_total + kernel_total;
usage = new ProcessStatistics.process_usage(kernel_total, user_total);
stats = new ProcessStatistics.process_statistics(p2.Value.dwProcID, p2.Value.sName,
usage, dtCurrent.Ticks, duration, processThreadStatsList);
if (exeFile != p2.Value.sName || bIncludeMySelf)
{
statisticsTimes[p2.Value.sName] = stats;
procStatsQueueBytes.Enqueue(stats.ToByte());
}
start = Process.GetTickCount();
}
onUpdateHandler(new ProcessStatsEventArgs(statisticsTimes, duration));
procStatsQueueBytes.Enqueue(ByteHelper.endOfTransferBytes);
((AutoResetEvent)eventEnableSend).Set();
}
}
catch (ThreadAbortException ex)
{
System.Diagnostics.Debug.WriteLine("ThreadAbortException: usageThread(): " + ex.Message);
}
catch (Exception ex)
{
System.Diagnostics.Debug.WriteLine("Exception: usageThread(): " + ex.Message);
}
System.Diagnostics.Debug.WriteLine("Thread ENDED");
}
The other thread, the socket thread, looks like this:
void socketThread()
{
System.Diagnostics.Debug.WriteLine("Entering socketThread ...");
try
{
const int ProtocolPort = 3001;
sendSocket = new Socket(AddressFamily.InterNetwork, SocketType.Dgram, ProtocolType.Udp);
sendSocket.SetSocketOption(SocketOptionLevel.Socket, SocketOptionName.Broadcast, 1);
sendSocket.SetSocketOption(SocketOptionLevel.Socket, SocketOptionName.SendBuffer, 32768);
IPAddress sendTo = IPAddress.Broadcast;
EndPoint sendEndPoint = new IPEndPoint(sendTo, ProtocolPort);
System.Diagnostics.Debug.WriteLine("Socket ready to send");
while (!bStopSocketThread)
{
eventEnableSend.WaitOne();
lock (lockQueue)
{
while (procStatsQueueBytes.Count > 0)
{
byte[] buf = procStatsQueueBytes.Dequeue();
if (ByteHelper.isEndOfTransfer(buf))
System.Diagnostics.Debug.WriteLine("sending <EOT>");
sendSocket.SendTo(buf, buf.Length, SocketFlags.None, sendEndPoint);
System.Threading.Thread.Sleep(2);
}
}
((AutoResetEvent)eventEnableCapture).Set();
}
}
catch (ThreadAbortException ex)
{
System.Diagnostics.Debug.WriteLine("ThreadAbortException: socketThread(): " + ex.Message);
}
catch (Exception ex)
{
System.Diagnostics.Debug.WriteLine("Exception: socketThread(): " + ex.Message);
}
System.Diagnostics.Debug.WriteLine("socketThread ENDED");
}
After setting up the socket for port 3001 the thread waits for the event
eventEnableSend. Then it starts the transfer of all en-queued packets. The last packet in the queue should be the <EOT> packet, which has been en-queued by the
usageThread. The usageThread is waiting during the transfer of the packets and will be released by the
socketThread with setting the event eventEnableCapture.
As we can only send bytes thru the socket, the process statistics class include functions to be converted to or from byte arrays. Here is a snippet of the
process_statistics class to show you how I did implement this.
public byte[] ToByte()
{
List<byte> buf = new List<byte>();
Int16 bLen = (Int16)System.Text.Encoding.UTF8.GetByteCount(sName);
buf.AddRange(BitConverter.GetBytes(bLen));
byte[] bName = System.Text.Encoding.UTF8.GetBytes(sName);
buf.AddRange(bName);
buf.AddRange(BitConverter.GetBytes(dateTime));
buf.AddRange(BitConverter.GetBytes(duration));
buf.AddRange(procUsage.ToByte());
buf.AddRange(BitConverter.GetBytes(processID));
Int16 iCnt = (Int16) ThreadStatList.Count;
threadStatistic[] threadsArray = ThreadStatList.ToArray();
buf.AddRange(BitConverter.GetBytes(iCnt));
foreach (threadStatistic th in threadsArray)
buf.AddRange(th.ToByte());
return buf.ToArray();
}
The packet (byte array) can vary in size as a string (the process name) has to be encoded and decoded. So the function first encodes the string length and then the string.
And here a function to get the object back from a byte array.
public process_statistics FromByte(byte[] buf)
{
int offset = 0;
Int16 bLen = BitConverter.ToInt16(buf, 0);
offset += sizeof(System.Int16);
if (bLen > 0)
this.sName = System.Text.Encoding.UTF8.GetString(buf, offset, bLen);
offset += bLen;
this.dateTime = BitConverter.ToInt64(buf, offset);
offset += sizeof(System.Int64);
this.duration = BitConverter.ToUInt32(buf, offset);
offset += sizeof(System.Int32);
this.procUsage = new process_usage(ref buf, ref offset);
this.processID = BitConverter.ToUInt32(buf, offset);
offset += sizeof(System.UInt32);
Int16 iCnt = BitConverter.ToInt16(buf, offset);
offset += sizeof(System.Int16);
List<threadStatistic> thList = new List<threadStatistic>();
for (int x = 0; x < iCnt; x++)
{
threadStatistic th = new threadStatistic(buf, ref offset);
thList.Add(th);
}
this.ThreadStatList = thList;
return this;
}
Here the string has to be decoded and so first the length has to be read and then the string.
On the PC
cpumonRcv runs on a PC in the same subnet as the device is running cpumon. The receiver code listens for packets coming on UPD port 3001 and then re-assembles the byte to process statistics. These stats are saved to a local database (currently
SQLite) and are send to the GUI for a live view.
The main function is the socket server thread code.
public void StartReceive()
{
    receiveSocket = new Socket(AddressFamily.InterNetwork, SocketType.Dgram, ProtocolType.Udp);
    bindEndPoint = new IPEndPoint(IPAddress.Any, 3001);
    recBuffer = new byte[maxBuffer];
    receiveSocket.Bind(bindEndPoint);
    receiveSocket.BeginReceiveFrom(recBuffer, 0, recBuffer.Length, SocketFlags.None,
      ref bindEndPoint, new AsyncCallback(MessageReceivedCallback), (object)this);
}
You see, that is not really a thread. Instead of polling the socket for received bytes within a thread, the code uses the asynchronous BeginReceiveFrom socket call.
The callback will be called whenever there are bytes received. As a packet always holds a complete statistic process data, the GUI can be updated after each received packet. But to be fast, the GUI is only updated when a <EOT> packet has arrived. The other stats data are delivered to the GUI thread, where they are recorded for later use and directly update the GUI.
When a packet has received, we must call BeginReceiveFrom again to be ready for the next packet.
void MessageReceivedCallback(IAsyncResult result)
{
EndPoint remoteEndPoint = new IPEndPoint(0, 0);
try
{
int bytesRead = receiveSocket.EndReceiveFrom(result, ref remoteEndPoint);
byte[] bData = new byte[bytesRead];
Array.Copy(recBuffer, bData, bytesRead);
if (ByteHelper.isEndOfTransfer(bData))
updateEndOfTransfer();
else
{
ProcessStatistics.process_statistics stats = new ProcessStatistics.process_statistics(bData);
updateStatus(stats);
}
}
catch (SocketException e)
{
System.Diagnostics.Debug.WriteLine(String.Format(
"MessageReceivedCallback SocketException: {0} {1}", e.ErrorCode, e.Message));
}
catch (Exception e)
{
System.Diagnostics.Debug.WriteLine(String.Format(
"MessageReceivedCallback Exception: {0}", e.Message));
}
try
{
receiveSocket.BeginReceiveFrom(recBuffer, 0, recBuffer.Length,
SocketFlags.None, ref bindEndPoint,
new AsyncCallback(MessageReceivedCallback), (object)this);
}
catch (Exception) { }
}
I placed the data capturing inside the GUI thread. The live view will be updated and a queue is filled with the data.
delegate void addDataCallback(ProcessStatistics.process_statistics procStats);
void addData(ProcessStatistics.process_statistics procStats)
{
if (this.dataGridView1.InvokeRequired)
{
addDataCallback d = new addDataCallback(addData);
this.Invoke(d, new object[] { procStats });
}
else
{
dataQueue.Enqueue(procStats);
dataGridView1.SuspendLayout();
dataAccess.addData(procStats);
dataGridView1.ResumeLayout();
dataAccess.waitHandle.Set();
}
}
A queue is used for the background task that saves the data to a file. Saving will need some time and should not
interfere with the live view or the data receive function.
Queue<System.Process.ProcessStatistics.process_statistics> dataQueue;
Thread myDataThread;

public EventWaitHandle waitHandle;
The data is ‘written’ to the local database using a separate thread.
void dataAddThread()
{
    try
    {
        while (true)
        {
            waitHandle.WaitOne();
            if (dataQueue.Count > 10)
            {
                while (dataQueue.Count > 0)
                {
                    System.Process.ProcessStatistics.process_statistics procStats = dataQueue.Dequeue();
                    addSqlData(procStats);
                }
            }
            Thread.Sleep(10);
        }
    }
    catch (ThreadAbortException ex)
    {
        System.Diagnostics.Debug.WriteLine("Exception: " + ex.Message);
    }
    catch (Exception ex)
    {
        System.Diagnostics.Debug.WriteLine("Exception: " + ex.Message);
    }
}
The receiver code has some time (3 seconds) to save the data between the send of two full statistic sets.
The live view shows a list of running processes in a datagridview and a small line plot of the usage times of the selected process.
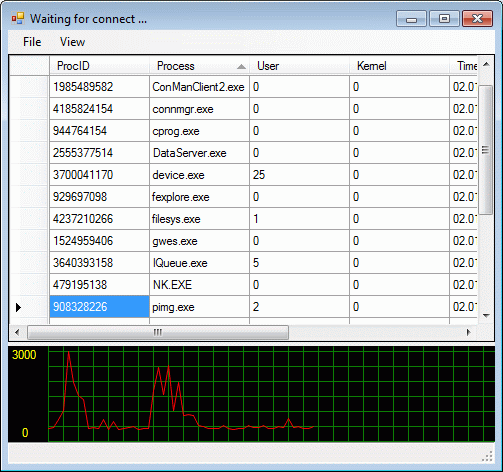
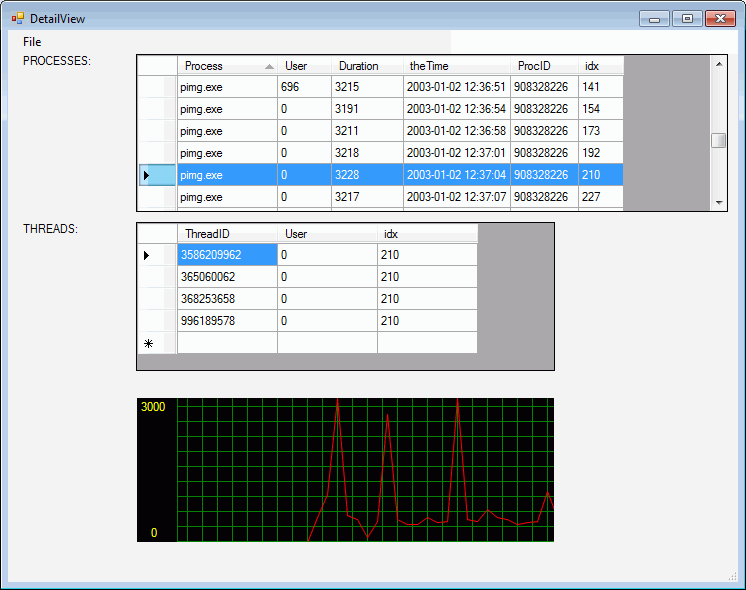
There is another data view that is not yet finished. The detail view shows a list of captured stats with the processes and the timestamp. If you click a line, the threads stats of the process are displayed with there usage. The detail view shows the saved data, where the main view shows live data.
Export and Excel analysis
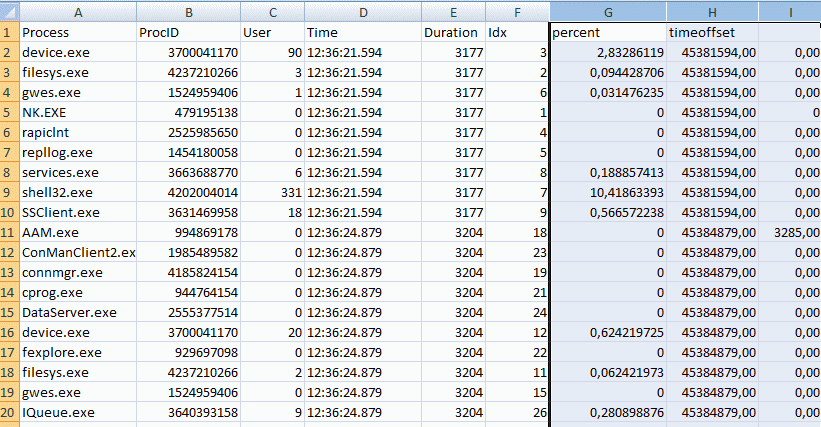
Now I have also finished export functions. From the detail form you can use the menu to export the process or threads table data to CSV files. These can be easily imported into other applications like for example excel or LibreOffice Calc. The below table is the result of a CSV import and adding some
calculated fields (the percent ‘of cpu usage’ is calculated by UserTime/Duration*100).
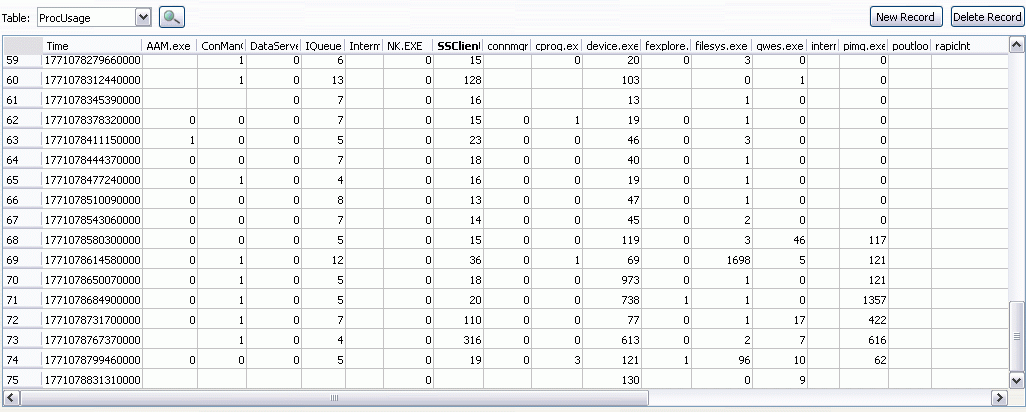
There is another export which first transforms the data and then exports to a CSV file. This CSV file is much easier to handle for analysis. It contains the recorded times, all processes and the time they spend in user (cpu usage) mode. The export does something like rotating the ‘processes’ table.
#region Transform
class PROCESS_USAGE
{
public string procname;
public int user;
public UInt64 timestamp;
public PROCESS_USAGE(string sProcessName, int iUserTime, UInt64 iTimeStamp)
{
procname = sProcessName;
user = iUserTime;
timestamp = iTimeStamp;
}
}
public int export2CSV2(string sFileCSV)
{
sql_cmd = new SQLiteCommand();
sql_con = new SQLiteConnection();
SQLiteDataReader sql_rdr;
connectDB();
if (sql_con.State != ConnectionState.Open)
{
sql_con.Close();
sql_con.Open();
}
sql_cmd = sql_con.CreateCommand();
long lCnt = 0;
sql_cmd.CommandText = "Select DISTINCT Process from processes order by Process";
List<string> lProcesses= new List<string>();
sql_rdr = sql_cmd.ExecuteReader();
while (sql_rdr.Read())
{
lProcesses.Add((string)sql_rdr["Process"]);
}
sql_rdr.Close();
sql_rdr.Dispose();
string sProcField = "";
foreach (string sProc in lProcesses)
{
sProcField += "[" + sProc + "] INTEGER,";
}
sProcField = sProcField.TrimEnd(new char[] { ',' });
sProcField = "[Time] INTEGER, " + sProcField;
lCnt = executeNonQuery("DROP Table IF EXISTS [ProcUsage] ;");
lCnt = executeNonQuery("Create Table [ProcUsage] (" + sProcField + ");");
List<PROCESS_USAGE> lProcessUsages = new List<PROCESS_USAGE>();
sql_cmd.CommandText = "Select Process,User,Time from processes order by Time";
sql_rdr = sql_cmd.ExecuteReader();
while (sql_rdr.Read())
{
string sP = (string)sql_rdr["Process"];
int iUT = Convert.ToInt32(sql_rdr["User"]);
ulong uTI = Convert.ToUInt64(sql_rdr["Time"]);
lProcessUsages.Add(new PROCESS_USAGE(sP, iUT, uTI));
}
sql_rdr.Close();
List<ulong> lTimes = new List<ulong>();
sql_cmd.CommandText = "Select DISTINCT Time from processes order by Time";
sql_rdr = sql_cmd.ExecuteReader();
while (sql_rdr.Read())
{
lTimes.Add(Convert.ToUInt64(sql_rdr["Time"]));
}
sql_rdr.Close();
string sUpdateCommand = "";
SQLiteTransaction tr = sql_con.BeginTransaction();
foreach (ulong uTime in lTimes)
{
System.Diagnostics.Debug.WriteLine("Updating for Time=" + uTime.ToString());
sql_cmd.CommandText = "Insert Into ProcUsage (Time) VALUES(" + uTime.ToString() + ");";
lCnt = sql_cmd.ExecuteNonQuery();
foreach (string sPro in lProcesses)
{
PROCESS_USAGE pu = lProcessUsages.Find(x => x.procname == sPro && x.timestamp == uTime);
if (pu != null)
{
System.Diagnostics.Debug.WriteLine("\tUpdating User="+ pu.user +" for Process=" + sPro);
sUpdateCommand = "Update [ProcUsage] SET " +
"[" + sPro + "]=" + pu.user +
" WHERE Time=" + uTime.ToString() +
";";
sql_cmd.CommandText = sUpdateCommand;
lCnt = sql_cmd.ExecuteNonQuery();
}
}
}
tr.Commit();
lCnt = 0;
SQLiteDataReader rdr = null;
System.IO.StreamWriter sw = null;
try
{
sw = new System.IO.StreamWriter(sFileCSV);
string sFields = "";
List<string> lFields = new List<string>();
lFields.Add("Time");
lFields.AddRange(lProcesses);
foreach (string ft in lFields)
{
sFields += ("'" + ft + "'" + ";");
}
sFields.TrimEnd(new char[] { ';' });
sw.Write(sFields + "\r\n");
sql_cmd.CommandText = "Select * from ProcUsage;";
rdr = sql_cmd.ExecuteReader(CommandBehavior.CloseConnection);
while (rdr.Read())
{
lCnt++;
sFields = "";
foreach (string ft in lFields)
{
sFields += rdr[ft] + ";";
}
sFields.TrimEnd(new char[] { ';' });
sw.Write(sFields + "\r\n");
sw.Flush();
}
}
catch (Exception) { }
finally
{
sw.Close();
rdr.Close();
}
return 0;
}
#endregion
That is the first time that I used a List<>.Find (PROCESS_USAGE pu = lProcessUsages.Find(x => x.procname == sPro && x.timestamp == uTime);). The ‘rotated’ table looks like this:
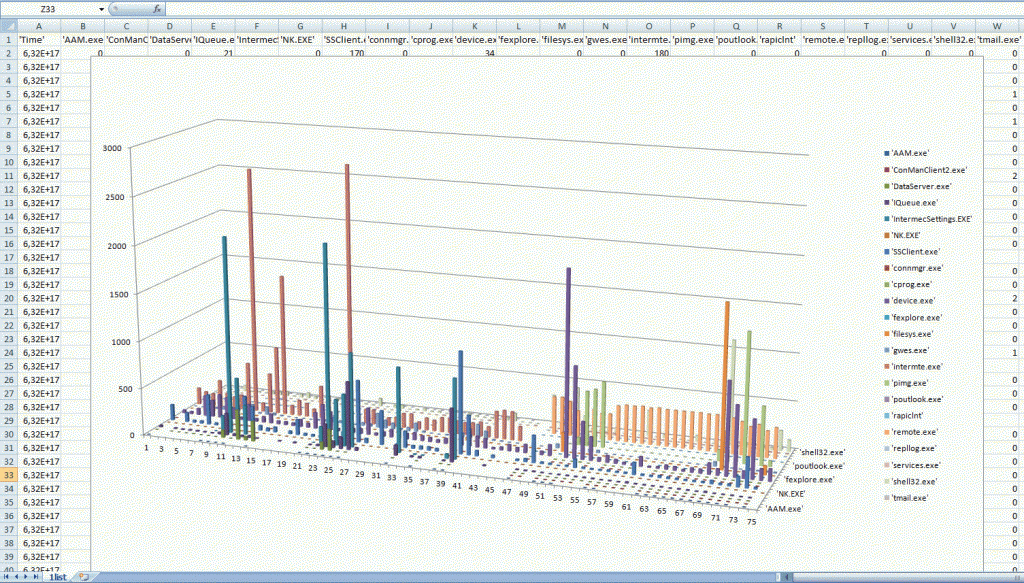
Using the above data enables you to create very informative 3D bar charts:
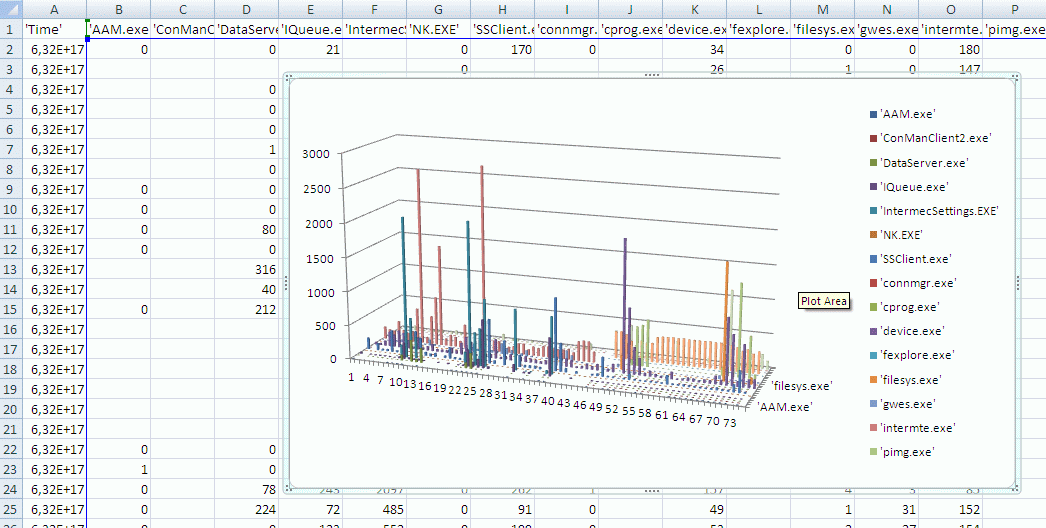
In the chart above you can see the time running from left to right. Each process has its own bar row. The height of the bar shows the relative
CPU usage against the measure interval duration of 3000ms (3 seconds).
Possible extensions and planned enhancements
The code is by far not perfect. If you look closer to the exported transformed data, you will recognize empty user time fields. That happens when the receiver thread is not active for example during a time expensive GUI update. So, there are possible improvements.
- Improve decoupling of receive and display of data
- Option to log CPU usage locally on the device (if not to time expensive)
- Integrate better graphics using MSChart?
Source code
Source code at code.google.com
Downloads
Binaries are available inside the Google code dirs for
cpumon2
and cpumonRcv.
For the PC you need the SQLite .Net runtimes installed.
