There is tremendous interest in Blazor WebAssembly. Developers are finally able to build browser-based Single Page Applications (SPA) using the language of their choice, such as C#. As of this writing, Blazor WebAssembly is in preview status. It is scheduled to release in May of 2020 as the team works to add features and improve the developer experience. One of the biggest challenges with Blazor WebAssembly projects is the lack of integrated debugging.

There is a debug experience that is slowly evolving. In the meantime, however, there are a few simple steps and practices you can follow to make life easier.
Use a Razor
I follow a “lowest common denominator” development philosophy. I pull out the things that can be shared most broadly into separate components and try to keep logic decoupled from framework implementations. For example, instead of embedding logic directly inside of Razor components, I prefer to use the Blazor MVVM pattern. This allows me to use a class library that can be shared between Blazor, ASP.NET MVC, WPF and even Xamarin (mobile) projects. The next “layer” is the view, and with Razor Class Libraries, the user interface (UI) can be shared as well!
Instead of building Razor components directly in your Blazor project, consider putting them in a Razor class library. Razor class libraries are not limited to native components; you can also embed JavaScript, images, and other resources that are shared as well. The code in this blog post is all contained in a sample app:
JeremyLikness/AdvancedBlazor
To start, I created a Razor class library and named it BlazorApp.Shared. The project template generates some default files that I overwrote with a few custom components. By default, a JavaScript file is embedded that returns text from a prompt.
window.exampleJsFunctions = {
   showPrompt: function (message) {
      return prompt(message, 'Type anything here');
   }
};
A class named ExampleJsInterop provides a wrapper around the call to JavaScript.
public class ExampleJsInterop
{
public static ValueTask<string> Prompt(IJSRuntime jsRuntime, string message)
{
return jsRuntime.InvokeAsync<string>(
"exampleJsFunctions.showPrompt",
message);
}
}
To make it easy to use JavaScript interoperability anywhere in the project, I added a using statement to _Imports.razor:
@using Microsoft.JSInterop
Next, I created a component named Prompter.razor that shows the prompt on a button click and updates some text. The template looks like this:
<div class="my-component">
This Blazor component is defined in the <strong>BlazorApp.Shared</strong> package.
</div>
<button @onclick="GetText">Enter Text</button>
<p>Prompt text: @Text</p>
The code-behind uses a JavaScript prompt to retrieve text and update the properties on the class.
public string Text { get; set; } = "Click the button to change this.";
public async void GetText()
{
   Text = await ExampleJsInterop.Prompt(JsRuntime, "Enter your text:");
   StateHasChanged();
}
I use the code generated by the template for this example. A better implementation than using a static method would be to provide an interface with the method signature and register the implementation as a singleton in the Startup class, then inject it when needed. This will make unit tests much easier to write.
The purpose of this simple component is to illustrate how I can write custom JavaScript and ship it in a shared library. I created another component called ShowHost that displays a date and the host (OS) platform as reported by System.Environment.OSVersion. You’ll see why later in this blog post. The template:
<h3>Your environment is: @OS (last refreshed at: @Refresh)</h3>
<button @onclick="DoRefresh">Refresh Environment</button>
The code-behind:
public string OS { get; set;} = "Not Set";
public string Refresh { get; set; } = "never";
protected override void OnInitialized()
{
   DoRefresh();
}
public void DoRefresh()
{
   OS = Environment.OSVersion.VersionString;
   Refresh = DateTime.Now.ToString();
}
Finally, I added a Wrapper control that wraps the other components, so I only need to drop a single component in my Blazor project. If I expand the example in the future I can embed additional components in Wrapper and not change my hosting projects. The Wrapper component has two instances of Prompter to show it works fine with multiple instances.
<h3>Wrapper</h3>
<h4>Environment:</h4>
<ShowHost></ShowHost>
<h4>First prompt:</h4>
<Prompter></Prompter>
<h4>Second prompt:</h4>
<Prompter></Prompter>
Serve your Blazor
The Razor class library doesn’t do much on its own. It needs a host project. To add a little twist, instead of hosting a Blazor WebAssembly project, the first project I created is a server-side project.
It turns out that Blazor has a few different hosting models. Although WebAssembly is still in preview, the Blazor Server hosting model is ready for production. You can learn more about it in the official documentation. I’m a WebAssembly fan myself, but there are a few reasons it makes sense to use a server-side project. First, it can reference the same Razor class library that Blazor WebAssembly uses. Second, it provides a fully integrated debug experience. Just set your breakpoint(s), hit F5 and you’re on your way!
In the project named BlazorApp.Server I added a reference to BlazorApp.Shared. Next, I needed to ensure the JavaScript file is properly loaded in my app. Fortunately, Razor class libraries expose a very simple convention to access embedded resources. Relative to the web page, you can access the resource using the convention: _content/{assemblyname}/{filename}. To include the script is as simple as adding the following script tag to _Host.cshtml:
<script src="_content/BlazorApp.Shared/exampleJsInterop.js"></script>
This is a manual step and must be repeated for any additional files. The Blazor team has good reasons for not automatically including the resources, such as the possibility of resource and naming conflicts. I have some ideas around making the process more “auto-discoverable” that I’ll explore in later posts. If you have a compelling reason to have this functionality “out-of-the-box”, let me know in the comments below and I’ll share your feedback with the team.
Next, I opened Index.razor and dropped in the Wrapper component:
@using BlazorApp.Shared
@page "/"
<h1>Hello, world!</h1>
Welcome to your new app.
<Wrapper></Wrapper>
To debug “the easy way” I put a breakpoint on the StateHasChanged() line in the Prompter component and hit F5. My app renders with my OS version (notice it’s my “server” or laptop version), date, and buttons.
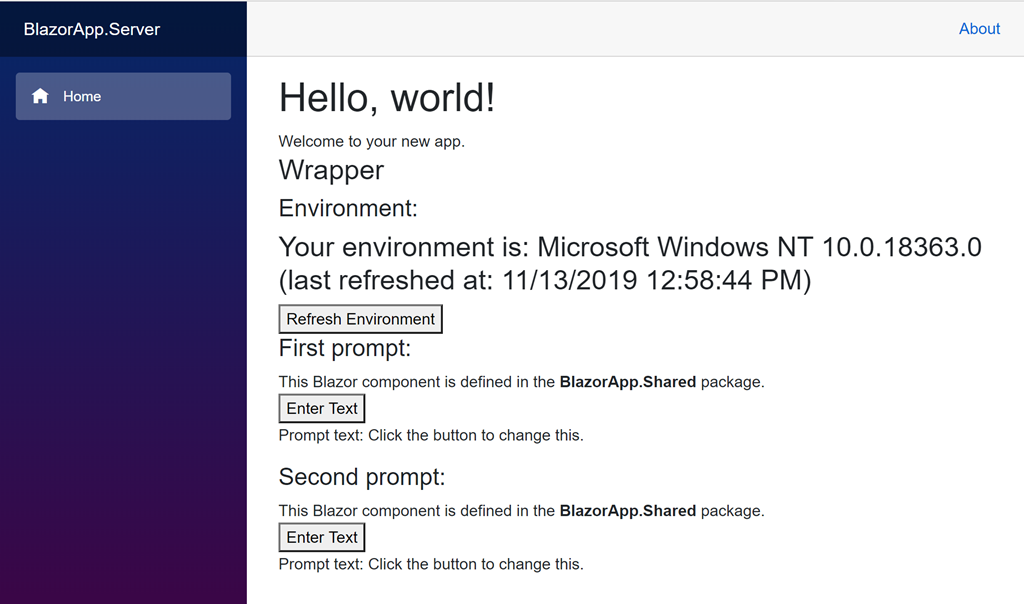
Clicking one of the “Enter Text” buttons results in the JavaScript prompt displaying, showing me that both embedding shared resources and JavaScript interoperability are working. After I enter text and click “OK”, the breakpoint is hit and I can inspect variables, modify properties, view the call stack and perform just about any other debug task I might want. Now the code looks good, so it’s time to create the Blazor WebAssembly project!
Debug the Client (Edge Edition)
After creating a Blazor WebAssembly project named BlazorApp.Client, I added a reference to the same Razor class library (BlazorApp.Shared) I used in the server-side app. I used the exact same convention to reference the JavaScript, only this time I placed the script tag in index.html under wwwroot instead of _Host.cshtml. The Index.razor modifications are identical to the server-side version. I set the startup project to the client and pressed CTRL+F5 to launch it. The result looks almost identical … with one exception. Do you see it right away?
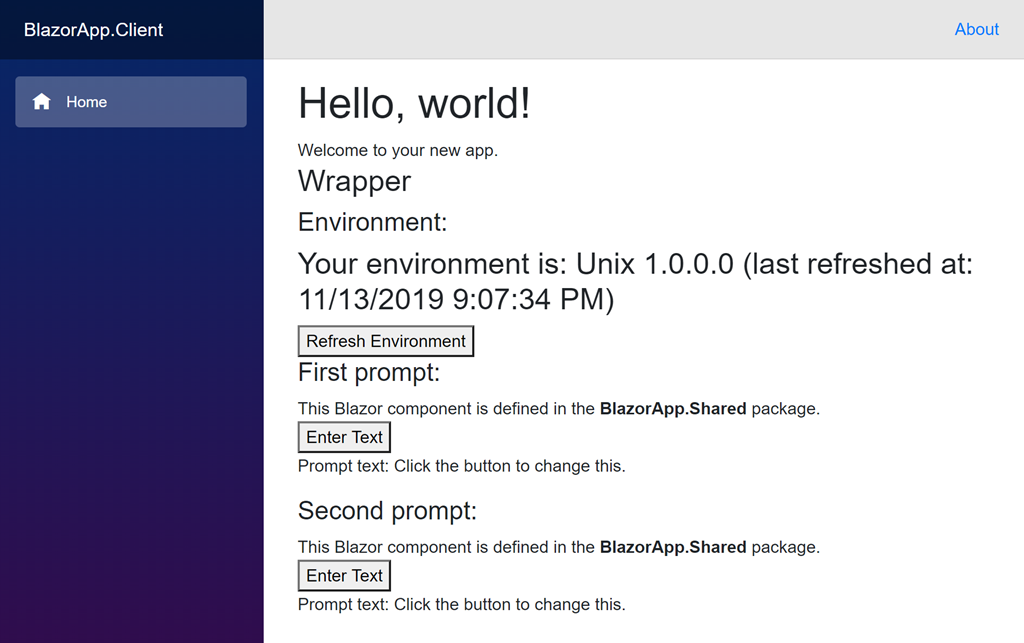
In case you missed it, the “platform” is reported as Unix 1.0.0.0. This is because the app is now running entirely in the browser, on Mono via WebAssembly. The rest of the functionality works mostly the same.
What if you need to debug the application now? If you open the debug console, you’ll see a message like this:
Debugging hotkey: Shift+Alt+D (when application has focus)
Chances are pressing the magic key combination results in an error with instructions on how to fix it.
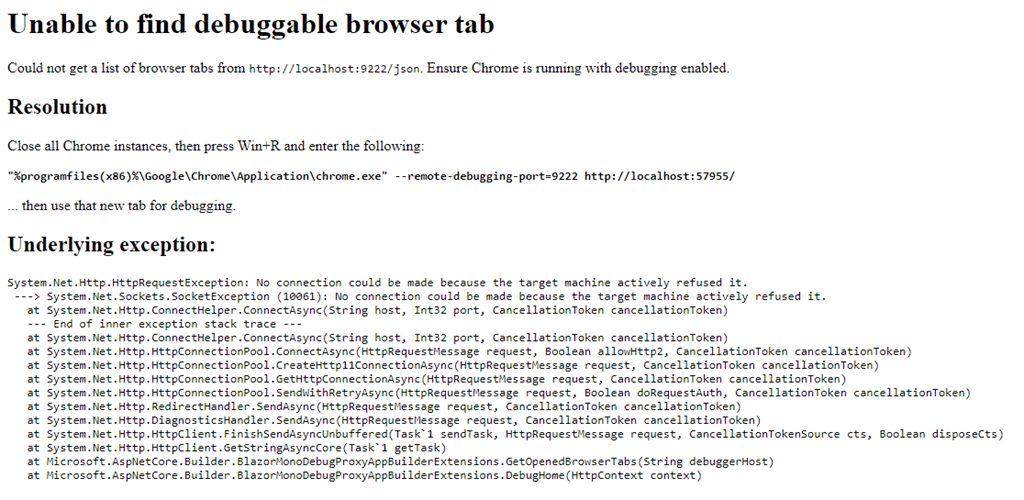
If you’re on Chrome, you’re good to go. Just note that you’ll need to close all existing Chrome windows and, if you have the Chrome accelerator in your task bar, exit from that, too.
But what if you use Edge? No problem! Close all your open Edge instances then run the following instead (I simply changed the path to point to my Edge install, yours may be different):
"%programfiles(x86)%\Microsoft\Edge Dev\Application\msedge.exe" --remote-debugging-port=9222 http://localhost:57955
Not sure what the path to your Edge install is? No problem. Just right-click on the icon you use to launch it and go into properties. You should either see a property with the path, or a shortcut tab with a “Target” property that contains the full path to the executable.
If your app is running on a different port, change the URL accordingly. This should bring up the app again. Hit the SHIFT+ALT+D combination and a new tab will open with some additional information. This is what mine looks like:
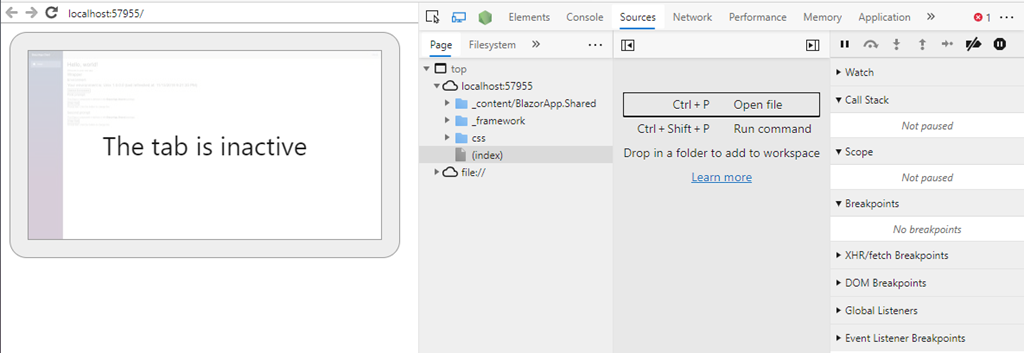
You can expand the virtual filesystem under file:// to navigate your source code and place a breakpoint on the same StateHasChanged() line we used in the server-side example. Flip back to the main tab, click the prompt, enter some text and hit “OK.” You should see a “paused in debugger” message. Head over to the debug tab and you can now see the breakpoint has been triggered. It is possible to expand the right panel under “Scope” to inspect the value of variables and properties.
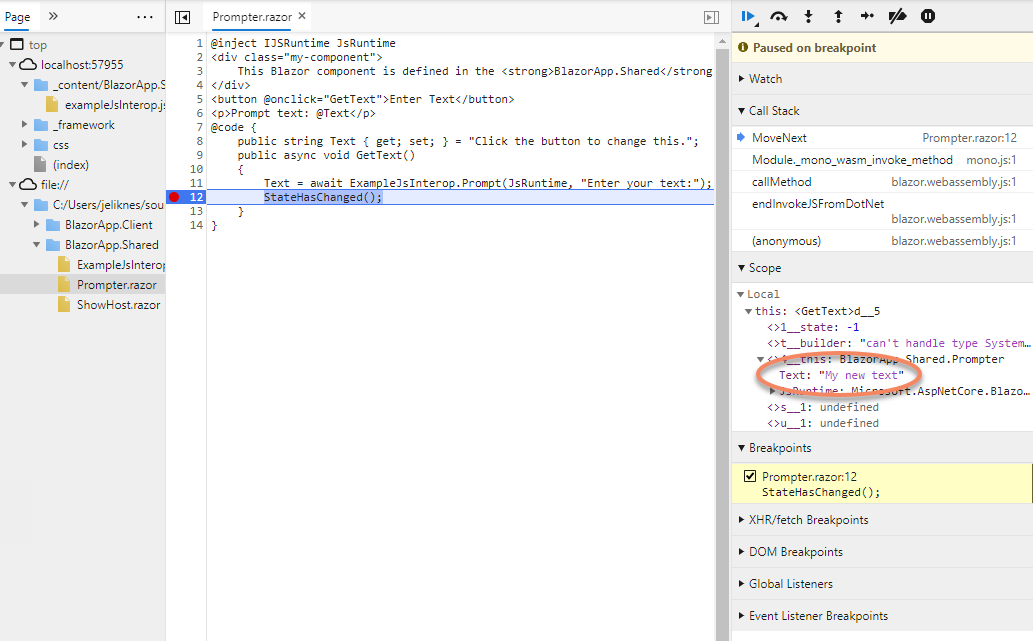
That’s the end of the magic trick!
In this blog post we explored:
- Using a Razor class library to improve the portability of our code
- Implementing a Blazor Server project for advanced debugging
- Debugging Blazor WebAssembly from the Edge browser
You can pull down the project from GitHub:
JeremyLikness/AdvancedBlazor
As always, I’d love to hear your thoughts and feedback. Start or join a discussion below!
Regards,

