In this article, a new system utilization dtop is introduced, which can be used to measure system utilization of applications and system performance.
Introduction
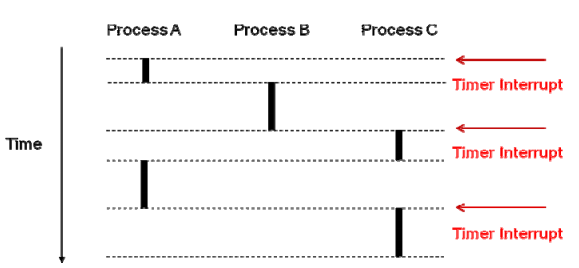
Most of the system utilization tools (e.g., top, htop) measure the system workloads by counting the interrupts of system timer, However, this is sometimes not accurate, like the following example:

Process A switches to Process B during the first interrupt and the second interrupt. However, the interrupts are included into Process A and Process C respectively. Process B is missed from the statistics. For the same reason, Process A is missed out during the second interrupt and the third interrupt.
Background
dtop is a tool written in Rust and designed to measure system utilization of applications and system performance. It calculates system load by a subtractive method. A background soaking task is executed on all system CPUs. If some new applications take up a certain amount of the system computing power, the background program will lose those computing power accordingly. So the system utilization by the new applications can be evaluated from the lost.
Using the code
Following code snippet creates a soaking thread on each CPU of the system. These threads have the lowest priority so that when the system has new tasks running, the system resources can be released from them.
let core_ids = core_affinity::get_core_ids().unwrap();

let mut channels: Vec<(Sender<i32>, Receiver<i32>)> = Vec::with_capacity(core_num);
for _ in 0..core_num {
    channels.push(mpsc::channel());
}

let mut counters: Vec<Arc<Mutex<i64>>> = Vec::with_capacity(core_num);
for _ in 0..core_num {
    counters.push(Arc::new(Mutex::new(0)));
}

let threads_info: Vec<_> = izip!(core_ids.into_iter(),
                                 channels.into_iter(),
                                 counters.into_iter()).collect();

let handles = threads_info.into_iter().map(|info| {
    thread::spawn(move || {
        let (core_id, ch, counter) = (info.0, info.1, info.2);
        core_affinity::set_for_current(core_id);

        match set_current_thread_priority(ThreadPriority::Min) {
            Err(why) => panic!("{:?}", why),
            Ok(_) => do_measure(&counter, ch),
        }
    })
}).collect::<Vec<_>>();
What these threads really do is the function "do_measure". In this function, there is an infinite loop calculating a prime number repeatedly and checking if there is a exit signal received.
fn do_measure(c: &Arc<Mutex<i64>>, ch: (Sender<i32>, Receiver<i32>)) -> bool {
    loop {
        let r: bool = is_prime(PRIME);

        let mut num = c.lock().unwrap();
        *num += 1;

        match (ch.1).try_recv() {
            Ok(_) | Err(TryRecvError::Disconnected) => {
                break r;
            },
            Err(TryRecvError::Empty) => {},
        }
    }
}
The number of runs of "is_prime" can be seen as the system performance score. The score represents the residual system performance. It represents the whole system performance if there are no workloads running on the system. Performance scores of different systems can be compared with each other. A higher score means a better performance.
fn is_prime(n: u64) -> bool {
    for a in 2..n {
        if n % a == 0 {
            return false;
        }
    }
    true
}
Following code snippets make periodic statistics of system performance. The interval can be configured as X seconds. The socres will be printed out every interval dynamically. The System Utilization is calculated as "(calibration_scores - total_score as f64) / calibration_scores * 100." It can be a negative number. This means less workloads than the last time you calibrate the system.
let when = Instant::now() + Duration::from_secs(parameter.interval as u64);
let task = Interval::new(when, Duration::from_secs(parameter.interval as u64))
    .take(run_times)
    .for_each(move |_| {
        let mut scores: Vec<i64> = vec![0; core_num];
        for i in 0..core_num {
            let mut num = counters_copy[i].lock().unwrap();
            scores[i] = *num;
            *num = 0;
        }

        for i in &mut scores {
            *i /= parameter.interval as i64;
        }

        if !parameter.calibrating {
            match File::open("scores.txt") {
                Err(_) => {
                    let total_score = scores.iter().sum::<i64>();
                    println!("Calibrating...");
                    println!("Scores per CPU: {:?}", scores);
                    println!("Total Calibrated Score: {}\n", total_score);
                    save_calibration(total_score);
                },
                Ok(_) => {
                    let total_score = scores.iter().sum::<i64>();
                    let calibration_scores: f64 = get_calibration() as f64;
                    println!("Scores per CPU: {:?}", scores);
                    match parameter.run_mode {
                        RunMode::AppUtilization => {
                            let rate = (calibration_scores - total_score as f64) /  calibration_scores * 100.;
                            println!("Total Score: {}        System Utilization: {:7.3}%\n", total_score, rate);
                        },
                        RunMode::SysPerformance => {
                            let rate = total_score as f64 / calibration_scores * 100.;
                            println!("Total Score: {}        Performance Percentage: {:9.3}%\n", total_score, rate);
                        },
                    }
                }
            }
        } else {
            let total_score = scores.iter().sum::<i64>();
            println!("Calibrating...");
            println!("Scores per CPU: {:?}", scores);
            println!("Total Calibrated Score: {}\n", total_score);
            save_calibration(total_score);
        }
        Ok(())
    })
    .map_err(|e| panic!("interval errored; err={:?}", e));

tokio::run(task);
Following are some examples of using the dtop. The command line is based on clap which is a Fast Configurable Argument Parsing for Rust language.
Calibrate the System
dtop -c	        // Calibrate the system with interval 1s.
dtop -c -i 5    // Calibrate the system with interval 5s.
Measure System Utilization of an Application Every 1s
dtop -c	    // Calibrate the system.
dtop        // Check the system utilization every 1s.
	...     // Run an application on the system.
Measure System Utilization of an Application Every 5s
dtop -c	    // Calibrate the system.
dtop -i 5   // Check the system utilization every 5s.
	...     // Run an application on the system.
Measure System Utilization of an Application With Step Mode
dtop -c	    // Calibrate the system.
	...     // Run an application on the system.
dtop -s	    // Check the system utilization caused by the application.
Measure a System Performance
dtop -m 1 // Check the measuring system performance.
Conclusion
In this article, a new system utilization dtop is introduced, which can be used to measure system utilization of applications and system performance. It adopts a "subtraction" method different from the traditional "addition" method based on system timer interrupt. It is very accurate and effectively avoids the statistical inaccuracy caused by the scheduling interval less than the system clock interrupt interval.
The source code can be downloaded from the Github: https://github.com/calinyara/dtop.
History
- 1st May, 2020: Initial version
- 5st May, 2020: v2 version
