
World of Tanks (WoT) Blitz is a session-based tank shooter that’s been constantly updated by MS-1 (Wargaming’s oldest and largest mobile studio) over the past 7 years since its release. In 2014, the game launched on iOS and Android; a couple of years later it was released on desktop platforms (Windows and macOS), and in 2020, WoT Blitz made its debut on Nintendo Switch. Android and iOS remain the key platforms for us, and it should be noted here that we strive to make Blitz scalable performance-wise; from super-low-end mobile devices to the latest flagships.
Performance is critical for every game. Our development team of almost 200 people working in independent, cross-disciplinary teams ships around 10 major updates every year. To keep up with this tempo and this scale, we have to automate a lot of processes, and performance testing is no exception. This blog explores how use of continuous integration (CI) testing helps us drive optimal player experiences for WoT Blitz. We’ll also dig into the following topics:
- Automated Performance Testing Methodology Overview
- CPU Profiling
- Arm Mobile Studio and Performance Advisor's role in our workflow
WoT Blitz Performance Testing Overview
If we put the game lobby aside and consider only the actual gameplay (battle arena), performance testing includes the control over the following metrics:
- Memory used by a process
- Map loading time
- Frame time
Automated tests are triggered nightly for mainline builds. QA engineers also trigger these tests when they are validating changesets containing one of the following:
- Content changes
- Code changes that potentially affect performance
We run tests using a CI server, where test devices play the role of build agents. Our test farm consists of more than 30 devices that represent all supported platforms and the entire performance level spectrum.
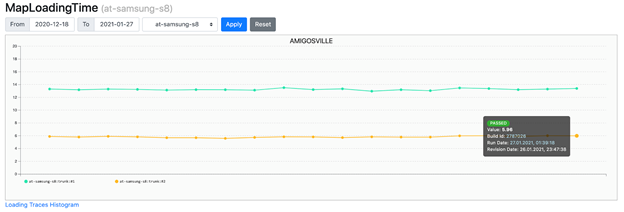
We do our best to identify problems before they go into the mainline, but if that happens, nightly regression tests will show it. As we have plenty of content and lots of device models, we made a special dashboard that displays all the nighttime test results. Below is the state of just a part of that dashboard (the full version has 13 columns and 30 rows) for a map loading time test.

With our development tempo and scale, it’s essential to have a healthy mainline: as we stick to the principle of early integration and a feature branch is always merged with the mainline when a build is assembled for testing, a problem in the mainline may be interpreted as a feature branch problem. As a result, we have strict regulations regarding fixing problems found in the mainline: the feature that caused a problem must be disabled or reverted within one working day.
Considering how much content we have, and how many platforms and performance levels we support, it’s hard to imagine our development without automated performance tests:
- If we had to manually run all the tests triggered nightly by automated processes, we would have to assign 2 or 3 full-time employees to that. But more likely, we would just compromise device or content coverage or frequency of regression tests and that would negatively impact the speed of development.
- Testing new content and features that need performance tests would take 10-20% more time than it does today. Also, more issues would sneak into the mainline because manual performance tests are less reliable.
The Need for Detailed Data in Reports
As we mentioned above, it’s critical for us to solve mainline problems within a single work day. But as we have lots of independent and specialized teams, first we have to find out which one is responsible for the problem. Though the tests are run nightly, with our development scale 10 to 15 non-trivial PRs are merged into the mainline every day. And it isn’t always possible to understand which one has caused a problem by simply looking at the code. That’s why we want the automated test reports to have as much detail as possible regarding what exactly caused some metric to change.
Besides defining which team is responsible for fixing a problem in the mainline, the extra data in the reports is very valuable for feature testing. Seeing detailed data in reports (e.g. which function is now taking longer to perform), a programmer is able to locate the problem even without manual profiling of the game. In the same manner, the content makers with access to this kind of data are able to understand right away where to look for optimization.
For example, for memory tests we use special builds with Memory Profiler. This can divide the entire memory pool used into"categories" (there are almost 30 of these) and see not just a change of a single value (the overall memory usage by a process), but a much more detailed picture:

For a map loading time test, the report contains just a number (loading time):
But in case there’s a problem, you can locate a json with profiler trace in test artifacts:
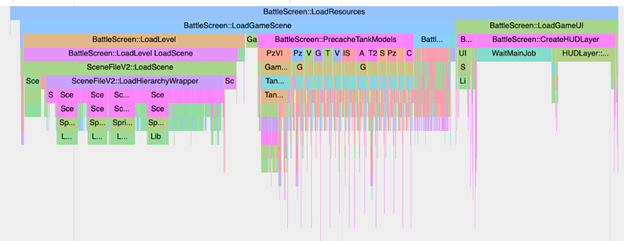
To sort everything out with the increased map loading time, it’s enough to just download json files of two test runs and compare them using chrome://tracing.
For FPS tests, we spent quite some time thinking of a convenient way to present the details in reports. But before showing what has come out of that, we’ll tell a bit about our general approach towards this type of tests.
FPS Tests Overview
The FPS tests are replay-based: after a new game map is added (currently there are 30 of them) we run a playtest, choose a single replay of it and put it into the repository. After that, this replay makes it to the FPS tests.
A replay is basically a log of all server messages plus a part of the state of the client (e.g. the camera view angle). Compared to tests scripted manually, such an approach has a range of advantages and disadvantages:
Advantages:
- The tests are very close to what players see: over the course of a replay, various gameplay events take place, all graphics elements (the UI, the particles) are displayed in the same quantity as they are in actual in-game situations.
- The tests for new maps are easy to obtain: there’s no scripting stage, you only need a playtest. Of course, you cannot call such a test a complete test of arena content: you only check the route taken by one specific player during the playtest. But to check the content, we have separate tests where the camera is consequently placed onto points of a 8x8 grid, rotating completely in each, in 45-degree increments.
Disadvantages:
- The tests take a significant time. A single map is processed within about 4 minutes, and if we multiply that by the amount of maps (30), it’s 2 hours.
- In a replay, the state of the game changes very dynamically, and sometimes it’s hard to relate a brief FPS drop to a concrete part of the replay.
How the CPU Profiler Enhances FPS Test Reports
For a long time, the sole result we observed in reports was the average FPS value. Also, among test run artifacts you could find a detailed chart for the FPS value during the replay, where points represented average FPS values for one second long intervals. The latter was a mistake, as single long frames were going under the radar. When we realized this, we decided to not just measure the duration of every single frame, but to go farther and switch on our internal CPU profiler for the tests. We had to limit the amount of counters for every frame so that the profiler wouldn’t impact the frame time on low-end devices. For that, we added the tagging functionality: every counter in the code is tagged, and we may switch tag groups on or off. By default, we have no more than 70 counters per frame when an automated test is launched.

Turning the profiler on in automated tests opens up a new opportunity: setting the budgets for separate functions’ work time. This allows you to trace spikes in the performance of certain systems. Besides that, budgeting makes it easier to take decisions about introducing new systems into the game. For example, when we decided to add the automated layouting of UI controls in battle several years ago, we just made sure that it wouldn’t impact FPS values in our tests. After we introduced the profiler, we were quite surprised by how much frame time we were spending on automatic layouting in some cases. The right approach would have been to define the budget before adding the new system (for example,"Layouting must work for no longer than 1 ms per frame on an Samsung S8") and to further control it with autotests so that the changes in code or content wouldn’t cause going over the budget.
At the end of a replay, we analyze the profiler trace and put a json containing only the frames with any functions exceeding their budget into artifacts. In the example below, several dozens of frames are listed; in each of them, the Scene::Update function took longer to perform than it should have.
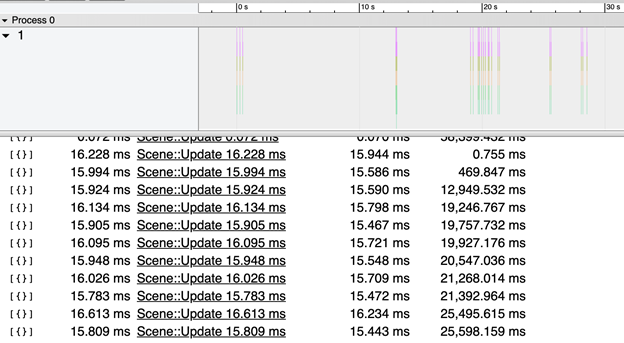
Everything is relatively simple with the spikes, but what representation would make it simple to notice small increases in execution time of some functions? Comparing two four-minute-long traces didn’t look like an acceptable option, so we decided to start with some statistics. For a small set of the most interesting functions, we calculate the amount of frames during which the function execution time hit a certain range, getting the frequency distribution:
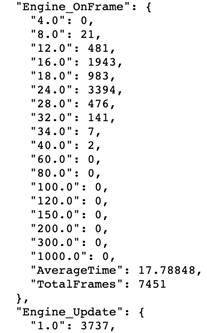
Next, we send this data into bigquery, and visualize them using datastudio:
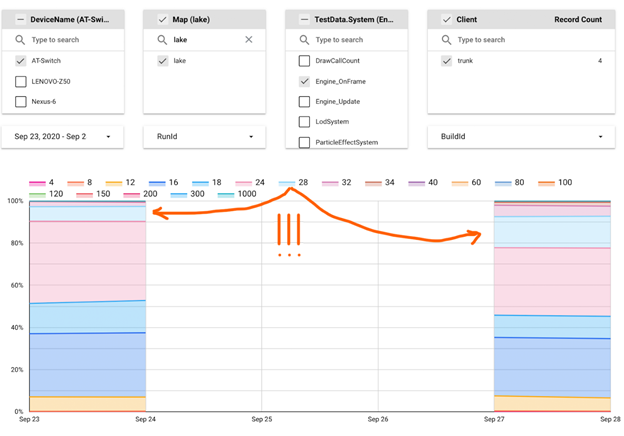
On the chart above, you can see that the number of frames where Engine::OnFrame took 24-28 ms to execute grew significantly on September 27. To find the cause for that, we can use a simple sequence:
- Go down the call stack by one level
- Successively choose the functions from this level of call stack via a dashboard filter, until we find the one causing the problem
- If we’re not on the lowest level yet, go to Step 1
If we have reached the lowermost level and found the ‘guilty’ function, it’s fine. But what if the execution time has grown more or less evenly for every function? There may be several reasons for that:
- There’s a huge chance that it's thermal throttling, one of the largest complications with performance testing on mobile devices. We solved this problem by placing our test device farm in a cold room. And though we created a bit unrealistic conditions for testing, we made the results stable on the majority of devices.
- A new thread has appeared, competing for CPU time with our code. This can be identified by a sampling profiler.
Though introducing an instrumenting CPU profiler into tests didn’t preclude the necessity of using a sampling profiler, it decreased the number of cases where the latter was necessary. One case was described above, the other is micro-optimisation when you need to see the execution time for separate instructions in the assembler code.
Let's get back to our "September 27" problem. Applying a sequence of actions listed above, we found that the rhi::DevicePresent function was the one to blame. This function just calls buffer swapping, so the bottleneck must be on the GPU side! But how can we learn what caused GPU to process frames longer from the reports?
GPU Metrics
An attentive reader may notice that one of the values in the filter on the datastudio screenshot above doesn’t look like a function name: "DrawCallCount". We have more metrics like that: "PrimitiveCount", "TriangleCount", "VertexCount". Alas, this is the only data we can gather on the CPU side to find out what caused the slowdown on the GPU side. But to solve the"September 27" problem, that was sufficient:
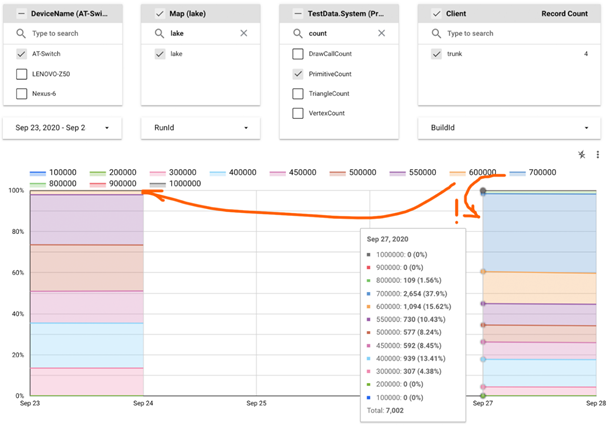
Turns out, we started to draw 150k more primitives in many frames. By matching this data to the list of PRs merged in the time interval between the two test runs (we see from the chart they were separated by 3 days, but 2 of these were weekend days with no tests) we identified the ‘guilty’ changeset promptly.
But what if the root of the problem was a shader getting more complicated? Or a change in the draw order and, as a consequence, increased overdraw? Or the depth buffer accidentally starting being saved into the main memory, impacting the bandwidth negatively?
These metrics are hard (in case of the overdraw) or impossible (in cases of shader complexity and bandwidth) to trace within the game itself. And here’s where Arm Mobile Studio Pro proves invaluable and helps us.
How Arm Mobile Studio Pro Provides the Insight into GPU Load
Arm Mobile Studio Pro allows us to record hardware counters for the Mali family GPUs while performing an autotest on a CI server, helping us solve three types of tasks:
- Find the answers to the question"What exactly has changed on the GPU side?" in regression tests
- Locate the bottlenecks during new content tests and understand what has to be optimized
- While introducing new graphical features, make conscious choices of target devices (as we mentioned in the beginning, we support a very broad spectrum of devices so the graphics features are generally activated via the graphics settings menu)
It is very important for us that Arm Mobile Studio features an instrument called Performance Advisor allowing us to present a profiler trace recorded during a test as an easily readable html report.
Let’s see how Arm Mobile Studio (and Performance Advisor in particular) speed up solving a Type 3 task.
Recently, we added decals into the engine, and our tech artist faced the task of defining the budget for overlapping of arena geometry and the decals. The essence of this task was:
- Defining the target devices on which we would like to make this feature available
- Preparing the test content by adding decals to an existing map for which the FPS test results were already here
- Run an autotest for a build with changed content on a target device
- Assess the results: if the FPS level decreases significantly, either review the content budget and go back to Stage 2, or review the target devices list
PA (Performance Advisor) simplifies Stage 4 greatly. Let’s suppose on Stage 1 we chose the Samsung Galaxy A50 with a Mali-G72 MP3 as our target device. Here’s how the first part of the PA report for a test run on this device looks (high graphics quality settings, but no decals for now):
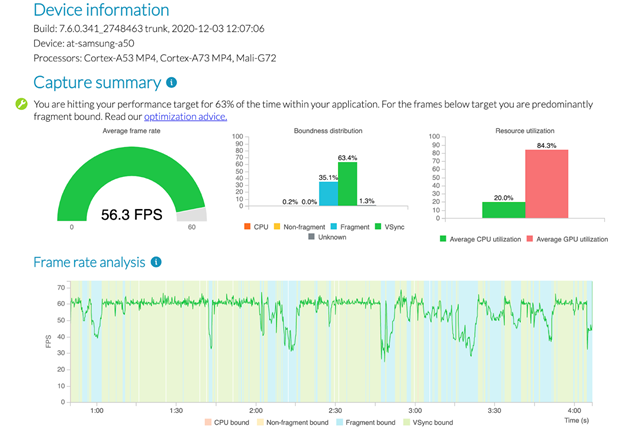
The main observations:
- FPS dropped to 30 at certain times. Well, we could have learned that without PA.
- In the problem spots the device obviously was fragment bound. That one is interesting! We can build prognoses regarding the content with decals.
We launch the test for a build with the decals, find the html report generated by PA within the artifacts, and open it:
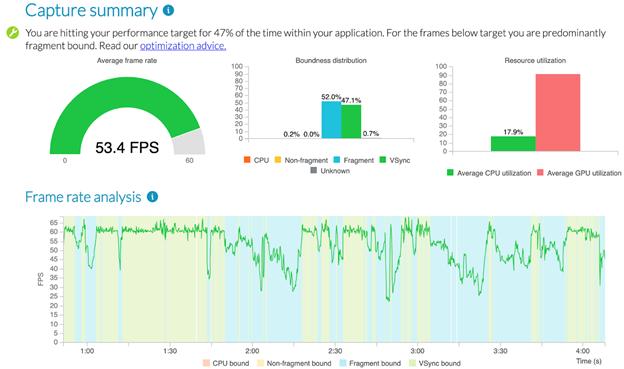
Well ... on this device and with the amount of decals that our tech artist added for the first iteration, the share of fragment-bound frames has increased significantly. Onward, to the next iteration!
PA will not directly show you the bottleneck in every single case. For example, for powerful devices we often see unknown boundness prevailing:
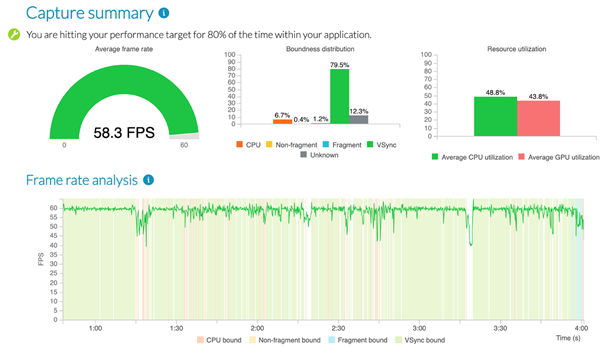
In this situation, complete capture files will help; you can download these from the artifacts of the test run and analyze them with Streamline. Luckily, performance counters are described in detail in the documentation, and Arm engineers are always ready to provide a consultation.
It should be noted that Arm Mobile Studio Professional Edition became part of our CI workflow easily and promptly. Besides convenient PA reports and full traces of the profiler, we also received a json file with average values and centiles for all the metrics shown on graphs in PA reports. In the near future, we plan to send that data to bigquery and visualize it using datastudio like we already do for our CPU profiler data. The metrics themselves are described here.
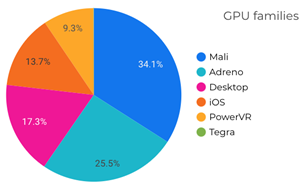
Whilst Arm Mobile Studio lets us obtain extra data only for the Mali family GPUs, they are the most wide-spread GPUs within our playerbase. Similarly, lots of observations that we can draw from the tests that run on devices with the Mali GPU family stay valid for other devices (for example, if the bandwidth has grown for Mali, it’s likely to have grown for other GPUs, and probably even for other platforms).
So, kudos to Arm: your tools allowed to solve our problem of the lack of data on GPU performance in automated test reports.
Conclusion
Here at MS-1 (Wargaming), we’re passionate about routine work automation. Performance testing has been automated for a long time, but there was still room for improvement.
Significant effort we had recently invested into the verbosity of test reports provided us with the automation framework that saves time for both testing and problem investigation. Now, we can identify a lot of problems with our code and content skipping the boring phase of manual profiling setup. Collecting profiling data in an automated test environment not only makes it more accessible, this approach also increases the quality of that data:
- A stable test environment means more stable data (especially important for mobile devices, where 3-5°C difference in room temperature can affect test results)
- Access to historical data provides a means for distinguishing noise from significant changes of performance metrics. And the quality of data dramatically affects the speed of analysis.
We think that automated performance testing is a must for any mid-sized or large game studio. It's not just about saving time for your people, it's also about the quality of testing and risk management: with nightly tests you don't need to worry about performance issues popping up during the final playtest and affecting your release schedule.
