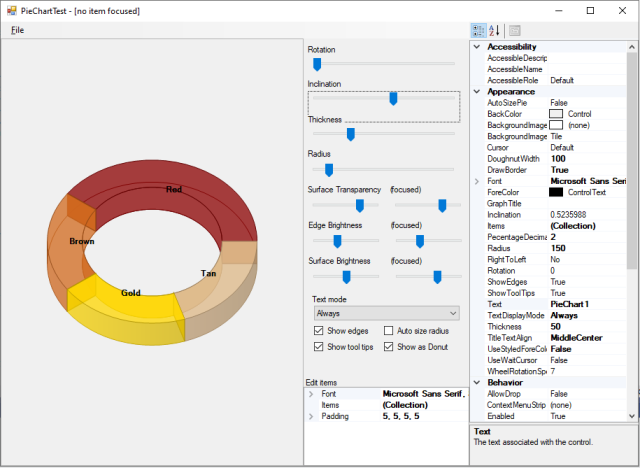
In this article, you will learn about a control that can display pie (and doughnut) charts with formatting that is highly customizable.
Version .NET Framework (4) running:

Version .NET 5 running (chart part of the window):

Introduction
After more than a decade, I updated the original project extending the functionality to doughnuts as well.
This code and part of this article are heavily taken from the article: A control to display pie charts with highly customizable formatting made by mattsj1984 which was previously taken from this article: 3D Pie Chart - CodeProject by Julijan Sribar.
WinForms should be dead ... but it is still alive!
To give a future to this control, I've also made the .NET 5 version of it.
Background
I needed a doughnut control for a project I'm working on, and a colleague of mine said: "well, just take a pie and draw a cylinder on it" ... and a couple of days ago, everything started (no, this is not the approach I've taken...).
Basically, I had to move from the "simple" DrawPie Directive:
public void DrawPie (System.Drawing.Pen pen, float x, float y, float width,
                     float height, float startAngle, float sweepAngle);
to DrawArc(s):
public void DrawArc (System.Drawing.Pen pen, System.Drawing.Rectangle rect,
                     float startAngle, float sweepAngle);
DrawPie is a single command and therefore the slice (top or bottom) is dedigned in one step, the you have to calculate the edges to connect the two slices.
Using DrawArc, you have to design the outer ellipse (made of single arcs, like the pieslices) and the inner one with a "distance" that is the doughtnut width, connected together.
This "distance" is changing according to the inclination, in fact, you have to take care of the perspective (projection), at 90° is full width:

at 0° the width is 0:

This is a good example of how to use the Math.Sin(Double) function, it does exactly this: value 1 for 90° and 0 for 0°:

in code:
float bottomInternalY = ((bottomExternalY) +
      (donutSize / 2) * (float)Math.Sin(Control.pieStyle.Inclination));
float topInternalY = ((topExternalY) +
      (donutSize / 2) * (float)Math.Sin(Control.pieStyle.Inclination));
Then comes another tricky part: you have to connect multiple Arcs and Lines to obtain a GraphicPath.
To achive this (have a connected path), you have to take care of the angles of drawing, and, usually, the second arc has to be drawed with negative angles.
Connecting Arcs also means that you have to have the StartingPoints and the EndPoints (ref. Points of Interest).
Using the Code
The control is structured much like a standard Windows Forms control, in terms of use. The PieChart itself contains an Items property, which is of type PieChart.ItemCollection. This collection stores objects of type PieChartItem. Each PieChartItem is comprised of the Text, ToolTipText, Color, Offset, and Weight properties.
To create and use the control, use the Windows Forms designer in Visual Studio to add a PieChart to a form and play with the chart properties:

Or you can use the control programmatically:
PieChart pieControl = new PieChart();
pieControl.DisplayDoughnut = true;
pieControl.Items.Add(new PieChartItem(10, Color.Red, "Text", "ToolTipText"));
pieControl.Items.Add(new PieChartItem(5, Color.Blue, "Blue", "BlueTips"));
pieControl.AutoSizePie = true;
pieControl.TextDisplayMode = PieChart.TextDisplayTypes.FitOnly;
pieControl.DrawBorder = false;
pieControl.GraphTitle = null;
I've added the property ItemTextTemplate, where with key-words #VALUE, #PERCENTAGE and #ITEMTEXT , the relative information can be displayed, triggered via the boolean UseItemTextTemplate.
(The decimal places for the percentage are managed via PecentageDecimals property.)
This is the result for:
pieControl.ItemTextTemplate = "Val: #VALUE - Perc: #PERCENTAGE - Text: #ITEMTEXT";
pieControl.UseItemTextTemplate = true;
pieControl.PecentageDecimals = 2;
is:

The classic functionalities (+ enhancements) are still there:

Points of Interest
Because I'm drawing arcs via GDI+, I needed to find "end points" and "starting point" of those arcs in order to create a path to fill or to draw (edges).
After searching, I went on a post (Getting End Point in ArcSegment with Start X/Y and Start+Sweep Angles) with the answer (for end point) from BlueRaja - Danny Pflughoeft.
I've made the helper class below that you can use with the signature of Graphics.DrawArc:
using System;
using System.Collections.Generic;
using System.Drawing;
using System.Drawing.Drawing2D;
using System.Linq;
using System.Text;
using System.Threading.Tasks;
using System.Windows.Forms;
namespace ModernUI.Charting
{
public static class ChartHelper
{
public static PointF GetStartingPoint
(float x, float y, double width, double height, double startAngle, double sweepAngle)
{
return GetStartingPoint(new PointF(x, y), width, height, startAngle, sweepAngle);
}
public static PointF GetStartingPoint(PointF startPoint, double width,
double height, double startAngle, double sweepAngle)
{
Point radius = new Point((int)width / 2, (int)height / 2);
startAngle = UnstretchAngle(startAngle, radius);
return new PointF
{
X = (float)(Math.Cos(startAngle) + 1) * radius.X + startPoint.X,
Y = (float)(Math.Sin(startAngle) + 1) * radius.Y + startPoint.Y,
};
}
public static PointF GetFinalPoint
(float x, float y, double width, double height, double startAngle, double sweepAngle)
{
return GetFinalPoint(new PointF(x, y), width, height, startAngle, sweepAngle);
}
public static PointF GetFinalPoint(PointF startPoint, double width,
double height, double startAngle, double sweepAngle)
{
Point radius = new Point((int)width / 2, (int)height / 2);
double endAngle = startAngle + sweepAngle;
double sweepDirection = (sweepAngle < 0 ? -1 : 1);
startAngle = UnstretchAngle(startAngle, radius);
endAngle = UnstretchAngle(endAngle, radius);
double angleMultiplier = (double)Math.Floor(2 * sweepDirection *
(endAngle - startAngle) / Math.PI) + 1;
angleMultiplier = Math.Min(angleMultiplier, 4);
double calculatedEndAngle = startAngle + angleMultiplier *
Math.PI / 2 * sweepDirection;
calculatedEndAngle = sweepDirection *
Math.Min(sweepDirection * calculatedEndAngle, sweepDirection * endAngle);
return new PointF
{
X = (float)(Math.Cos(calculatedEndAngle) + 1) * radius.X + startPoint.X,
Y = (float)(Math.Sin(calculatedEndAngle) + 1) * radius.Y + startPoint.Y,
};
}
private static double UnstretchAngle(double angle, Point radius)
{
double radians = Math.PI * angle / 180.0;
if (Math.Abs(Math.Cos(radians)) < 0.00001 ||
Math.Abs(Math.Sin(radians)) < 0.00001)
return radians;
double stretchedAngle = Math.Atan2(Math.Sin(radians) / Math.Abs(radius.Y),
Math.Cos(radians) / Math.Abs(radius.X));
double rotationOffset = (double)Math.Round(radians / (2.0 * Math.PI),
MidpointRounding.AwayFromZero) -
(double)Math.Round(stretchedAngle / (2.0 * Math.PI),
MidpointRounding.AwayFromZero);
return stretchedAngle + rotationOffset * Math.PI * 2.0;
}
}
}
History
- 13th April, 2021: Revision 0: Original version
- 14th April, 2021: Revision 1: Added the .NET5 Version
