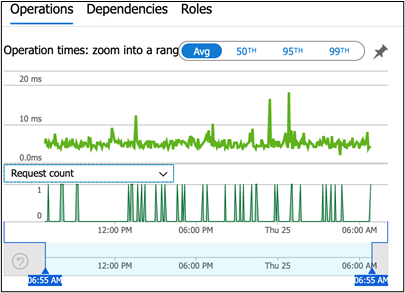
Knowing the health of your applications is essential. If your service becomes unavailable, there could be a loss of productivity and delays in other processes. You can keep track of your application’s availability in several ways. Azure Monitor offers a way to collect and analyze information on your application’s performance and events. Azure Monitor collects information such as metrics (numerical data) and logs (data made of a collection of attributes of different types of data). Application Insights provides visualization of the data.
Azure Monitor already collects some information on services that you add. Additionally, it supports collecting information from Prometheus. Prometheus is a popular solution from the Cloud Native Computing Foundation for collecting metrics from an application.
Adding the Application Insights Agent
Application Insights can monitor your AKS applications without any changes to the source code. To add Application Insights to your application, add the Application Insights agent to your project.
Then, add an Application Insights resource to your Azure account. To do this, in portal.azure.com, type "Application Insights" in the search bar and select it from the results.

After selecting it, you will see a list of your Application Insights resources. This list may be empty. To create a new resource, click the +Create button. Application Insights prompts you to choose a resource group and to provide a name for your new resource. Choose a resource group from the menu and enter a descriptive name. Then click Review + Create.

The Azure portal performs a validation step. After validation, click Create. After a few seconds, the Azure portal creates the resource. If you return to the Application Insights resource list, your new resource is there. If you select it, the details for it appear. An element of interest is the Connection String on the right side of the details. You will need that information.

Application Insights uses a Java agent to capture the logging. Java agents are special classes that use the Java instrumentation API to intercept calls. This allows us to add Application Insights support without modifying our code. Download the Application Insights JAR and note the location where you have saved it. To add the jar to the project, use the maven command-line tool.
mvn  install:install-file
 -Dfile=/path-to-downloaded-file/applicationinsights-agent-3.0.2.jar
 -DartifactId="applicationinsights-agent" -Dpackaging=jar
 -Dversion="3.0.2"
 -DgroupId="com.microsoft"
Also, add a file named applicationsinsights-agent-3.0.2.json. The content of the JSON file is:
{
"connectionString": "InstrumentationKey=..."
}
You see the actual value to apply to the connectionStrings element when you view your Application Insight’s resource in the Azure portal. Once your application is configured and redeployed, Application Insights automatically logs information that your application emits through java.util.logging, and information from other logging utilities.
Once you have instrumented the application for Application Insights and deployed it, metrics and logging for the application are viewable through the Azure portal. To begin viewing metrics for your application, open Application Insights from the Azure portal. Select your application, then select one of the metrics to view the measurements graphically.

Because of the native support that Azure offers to Java applications for logging and gathering metrics, getting started with logging requires little effort. Some of the metrics that Azure collects it collects automatically. Azure integrates with popular libraries for managing logging in applications. This includes Log4j, solutions that use the Simple Logging Facade for Java (SLF4J), and the built-in java.util.logging functionality.
Customizing Logging
You can configure additional options for logging through your application insights configuration file (applicationinsights-agent-3.0.2.json). By default, Application Insights captures any logging at the INFO level or higher. If your concern is only for logging labeled as WARN or higher, specify it in the configuration file with the following.
{
  "instrumentation": {
    "logging": {
      "level": "WARN"
    }
  }
}
The configuration can specify a sampling percentage for transactions to reduce cost. For example, if the sampling percentage was 20 percent, then 20 percent of transactions performed have their details logged. In the configuration, you specify the sampling rate with the following element.
{
  "sampling": {
    "percentage": 20
  }
}
While Application Insights automatically collects many metrics, additional metrics are available from the Java components you use. To capture these metrics, you must know the object’s name and attribute for additional metrics you would like to capture. To find this information, you may need to use another tool, such as JDK Mission Control. Once you have this information, add it to your configuration file in an element named jmxMetrics. This element lists objects that specify the object name, attribute, and name that will serve as a label in the Application Insights console.
"jmxMetrics": [
      {
        "name": "Thread Count",
        "objectName": "java.lang:type=Threading",
        "attribute": "ThreadCount"
      }
]
Several other aspects of the application logging are customizable. You can read more about configuring codeless application monitoring and logging from here.
Application Scaling
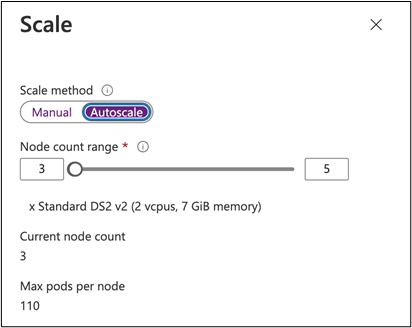
You can use Azure Monitor to scale your application in response to demand. By scaling according to demand, you can minimize your resource use without making compromises on performance. Autoscaling is especially helpful when the application’s use patterns are unpredictable, or you do not fully understand them. To scale your Azure Kubernetes application, the Node Pool setting provides two options. For manual scaling, you select the number of nodes instantiated. For automatic scaling, you select the minimum and the maximum number of nodes. AKS automatically changes the number of nodes.

Azure responds to scaling needs based on average metrics over some length of time. An average of over 45 minutes is the default, but the time used for the Kubernetes is adjustable in the Cloud Shell.
Conclusion
In the next part of this series, we look at how your application knows it is in use. We also look at how Azure provides support through its services and free code libraries for authenticating your user.
